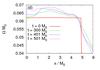
Fig. 8
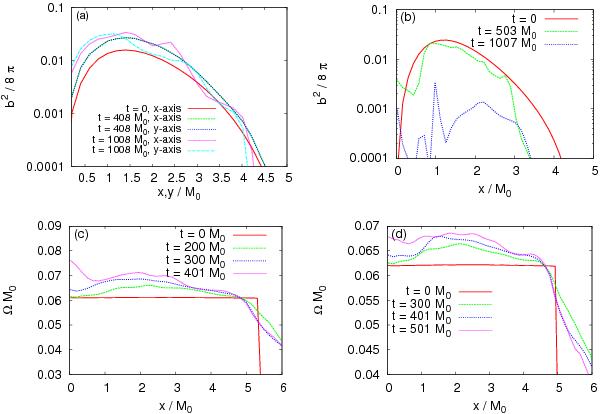
Snapshots of magnetic pressure a) for model R22H2T8 and b) for mode N22H5, and those of angular velocity profiles c) for model R22H2T8 and d) for model R22H08T8. Both profiles are plotted along the x-axis on the equator. In panel a), the profile along y-axis is also plotted. In panels c) and d), it is seen that the negative gradients of the angular velocity profiles are developed near the stellar surface.
Current usage metrics show cumulative count of Article Views (full-text article views including HTML views, PDF and ePub downloads, according to the available data) and Abstracts Views on Vision4Press platform.
Data correspond to usage on the plateform after 2015. The current usage metrics is available 48-96 hours after online publication and is updated daily on week days.
Initial download of the metrics may take a while.