Fig. 2
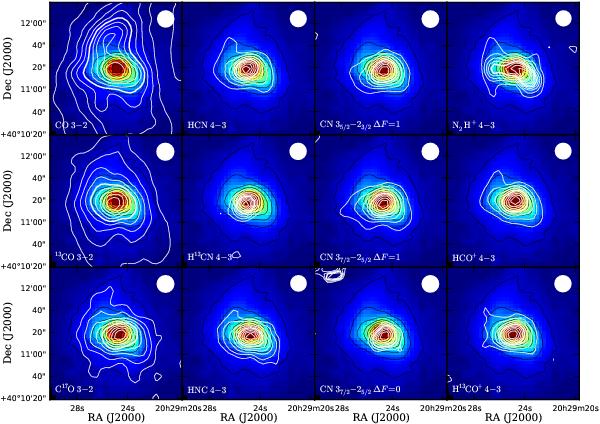
Maps of emission from the 3–2 transitions of CO, 13CO, C17O, transitions of N-bearing molecules, HCO+ and H13CO+ 4–3. White contours represent integrated line emission and are at 90%, 80%, ..., 10% of the maximum intensity, listed in Table 2. The contour at 50% is thicker. An extra contour is added for HNC 4–3 at 5% of the maximum intensity. The beam size at the relevant frequency is indicated in the top right corner of each panel. To avoid noise in the figures, contours below 0.7 K km s-1 are not shown. SCUBA 850 μm continuum emission is shown in color scale and thin black contours; the color scale is stretched from 10 to 5600 mJy beam-1.
Current usage metrics show cumulative count of Article Views (full-text article views including HTML views, PDF and ePub downloads, according to the available data) and Abstracts Views on Vision4Press platform.
Data correspond to usage on the plateform after 2015. The current usage metrics is available 48-96 hours after online publication and is updated daily on week days.
Initial download of the metrics may take a while.