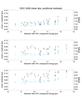
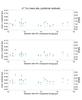
Fig. 5

Mean of the absolute values of the positional residuals over the diameter of 50% ensquared energy. The upper panels present the NGC 6388 data set and the lower panels the 47 Tuc data set. The plot shows from top to bottom the mean of the absolute values of the residuals to the master frame in the x- and y-directions and the separation  after a 4th order polynomial correction (diamonds ◇) and after the correction of x and y-shift, x and y-scale, and rotation (crosses × ). The overplotted error bars correspond to the error in the mean value
  , with n equal to the number of stars used to calculate the mean value and σ being the standard deviation. The left y-axis shows the residuals in units of pixel and the right one in units of mas.
Current usage metrics show cumulative count of Article Views (full-text article views including HTML views, PDF and ePub downloads, according to the available data) and Abstracts Views on Vision4Press platform.
Data correspond to usage on the plateform after 2015. The current usage metrics is available 48-96 hours after online publication and is updated daily on week days.
Initial download of the metrics may take a while.