Fig. 8
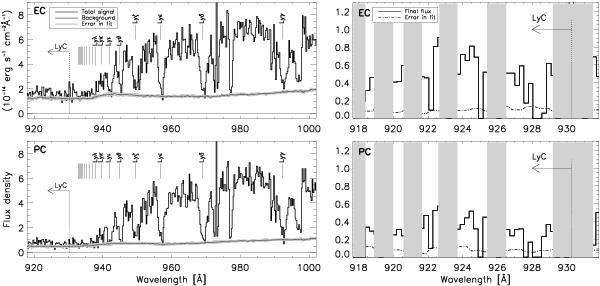
The Haro 11 SiC 2A spectrum. The upper panels show the data reduced as extended source (EC) and the lower panels as point source (PC). The binning is 0.23 Å. Left: the total signal is plotted in black, the new background in dark gray and the error in the background fit in light gray. We also indicate some intrinsic Haro 11 Lyman lines, of which only Lyϵ at 957 Å falls in a region uneffected by geocoronal or solar scattered light emission. Right: a closer view of the LyC region. Here, the background has been subtracted from the total signal, and the plot hence show the final flux density of Haro 11. The airglow regions are marked with gray vertical bars.
Current usage metrics show cumulative count of Article Views (full-text article views including HTML views, PDF and ePub downloads, according to the available data) and Abstracts Views on Vision4Press platform.
Data correspond to usage on the plateform after 2015. The current usage metrics is available 48-96 hours after online publication and is updated daily on week days.
Initial download of the metrics may take a while.