Fig. 6
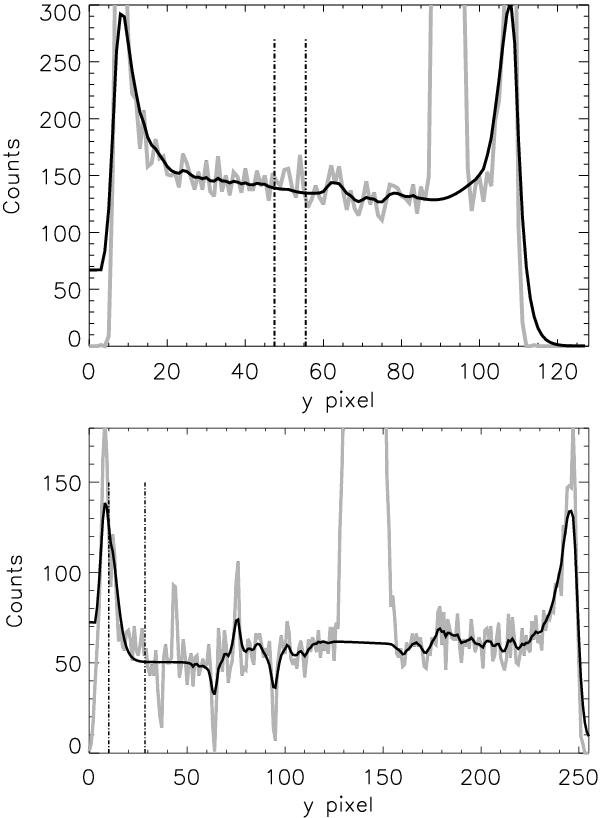
The 2A (upper) and 1B (lower) segments plotted with night-only data. The signal summed over the LyC range (920–929 Å) in the SiC spectrum is plotted in gray, with the new background fit overplotted in black. The vertical hatched lines indicate the extraction regions for the LWRS extended source apertures. The SiC 2A spectrum is centered at y pixel ~52, while the SiC 1B is centered at pixel ~20. A weak excess can be seen in the LyC region for both spectra.
Current usage metrics show cumulative count of Article Views (full-text article views including HTML views, PDF and ePub downloads, according to the available data) and Abstracts Views on Vision4Press platform.
Data correspond to usage on the plateform after 2015. The current usage metrics is available 48-96 hours after online publication and is updated daily on week days.
Initial download of the metrics may take a while.