Fig. 5
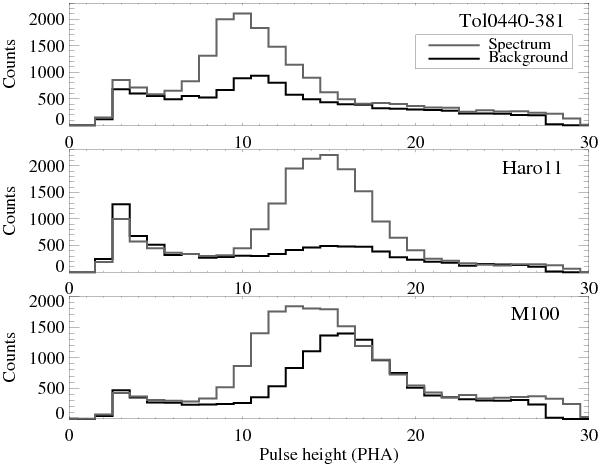
The pulse height distributions for three different galaxies observed at different voltage settings throughout the mission. The pulse height distribution of the 920–980 Å wavelength region in the SiC 2A spectrum is plotted in gray, with the background distributions from an equally large area under the spectrum plotted in black. Upper: Tol 0440-381, middle: Haro 11, lower: M 100. The drift between the two distributions show that the differential loss of sensitivity for the spectrum and background regions could have a significant effect for M 100, which was observed late in the mission after several detector voltage changes. In addition, for Haro 11 and Tol 0440-381 there is a slight shift, indicating that there might be some effect present.
Current usage metrics show cumulative count of Article Views (full-text article views including HTML views, PDF and ePub downloads, according to the available data) and Abstracts Views on Vision4Press platform.
Data correspond to usage on the plateform after 2015. The current usage metrics is available 48-96 hours after online publication and is updated daily on week days.
Initial download of the metrics may take a while.