Fig. 4
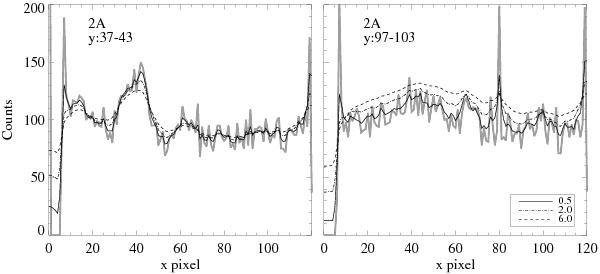
The signal in the 2A detector segment plotted over the whole x range, summed over row pixels y = 37–43 (left panel) and y = 97–103 (right panel). The left panel samples the background and background fits just below the SiC spectrum, while the right panel samples the background and background fits just above the LiF spectrum. The original signal is plotted in gray, and three different background fits are overplotted: Λx = Λy = 0.5 (solid), Λx = Λy = 2.0 (hatch/dot), and Λx = Λy = 6.0 (hatched).
Current usage metrics show cumulative count of Article Views (full-text article views including HTML views, PDF and ePub downloads, according to the available data) and Abstracts Views on Vision4Press platform.
Data correspond to usage on the plateform after 2015. The current usage metrics is available 48-96 hours after online publication and is updated daily on week days.
Initial download of the metrics may take a while.