Fig. 3
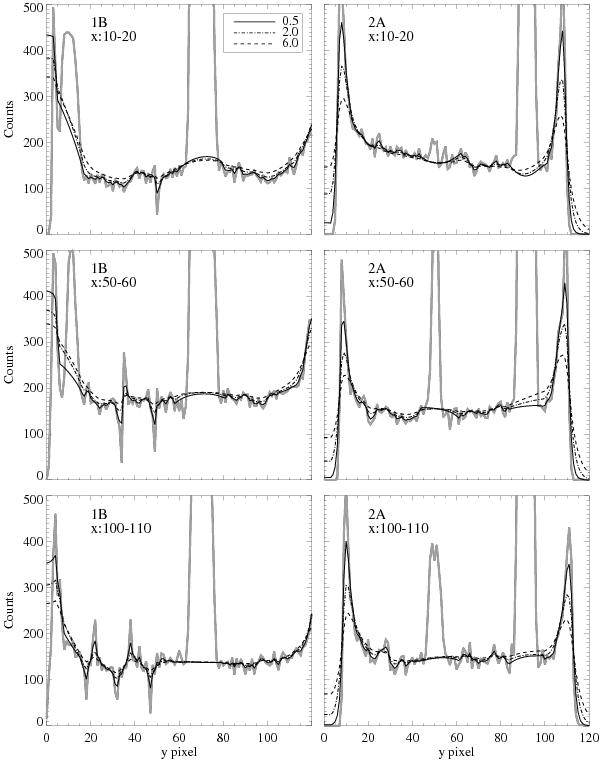
The 1B (left) and 2A (right) detectors plotted in the cross-dispersion direction. The data were reduced as extended source, and were binned with a factor 128 in x and 8 in y, to a 128 × 128 pixel sized image. The data are summed over the pixel intervals x = 10–20 (upper), x = 50–60 (middle) and x = 100–110 (lower). The original signal is plotted in gray, with three different background fits overplotted in black: Λx = Λy = 0.5 (solid), Λx = Λy = 2.0 (hatch/dot, and Λx = Λy = 6.0 (hatched). The SiC spectra are centered at y pixel ~10 for 1B and y pixel ~50 for 2A, while the LiF spectra are centered at ~70 for 1B and ~92 for 2A. The narrow dips and peaks that are the most prominent on the 1B detector are artifacts of pipeline processing (Dixon 2007, priv. commun.).
Current usage metrics show cumulative count of Article Views (full-text article views including HTML views, PDF and ePub downloads, according to the available data) and Abstracts Views on Vision4Press platform.
Data correspond to usage on the plateform after 2015. The current usage metrics is available 48-96 hours after online publication and is updated daily on week days.
Initial download of the metrics may take a while.