Fig. 1

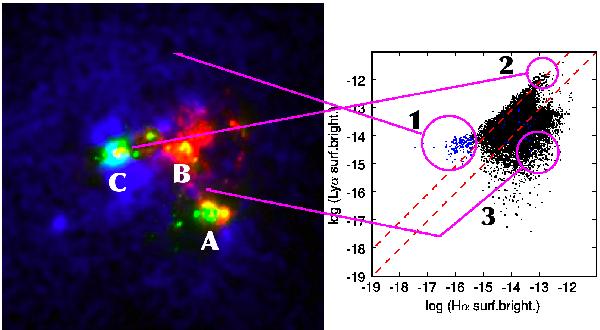
Left: composite HST image of Haro 11. Image scale is 15 × 15″. East is left, north is up. The Lyα emission is shown in blue, the ionized gas via Hα in red and the UV-continuum in green. The three main star-forming knots A, B and C are labelled. Right: the Lyα vs. the Hα surface brightness for the binned elements in the image. The hatched lines show Lyα = Hα and the case B Lyα/Hα = 8.7. At low surface brightness (1) the theoretical ratio is exceeded due to resonant scattering making the Lyα emission off-set from the ionized regions, while at higher surface brightness; (2) the top edge of the distribution agrees with the recombination value, indicating that the Lyα photons from these regions are scattered just a few times before escaping. Regions with heavy extinction can also be seen at high Hα surface brightnesses (3). The figure is an altered composite of Figs. 3 and 4 in Östlin et al. (2009) (see this article for further information). (A color version of this figure is available in the online journal.)
Current usage metrics show cumulative count of Article Views (full-text article views including HTML views, PDF and ePub downloads, according to the available data) and Abstracts Views on Vision4Press platform.
Data correspond to usage on the plateform after 2015. The current usage metrics is available 48-96 hours after online publication and is updated daily on week days.
Initial download of the metrics may take a while.


