Fig. 6
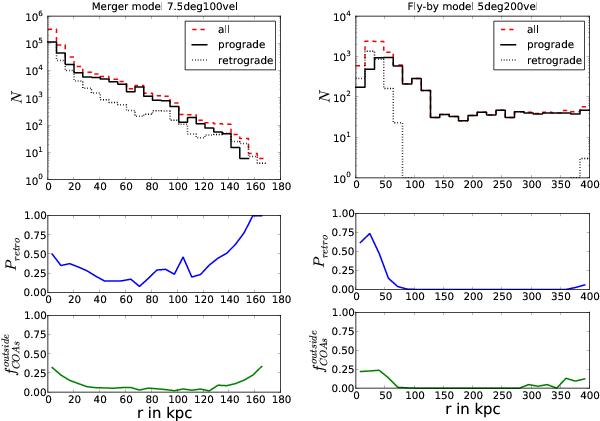
The radial distribution of particles in the merger model 7.5deg100vel (left) and fly-by model 5deg200vel (right) at the final snapshot. The top panels give the number of particles in each bin, the 25 bins are plotted logarithmically to account for the vast range in numbers. They have a width of 6.8 kpc in the merger and 16 kpc in the fly-by case. Particles counted as prograde and retrograde are those within the respective COAs of 60° (merger) and 30° (fly-by) radius. The middle panel shows Pretro, the fraction of retrograde material. The bottom panel plots  , the fraction of all particles that are neither in the pro- nor in the retrograde COA. Merger: both pro- and retrograde material exists out to a maximum distance of about 160 kpc. Pretro is highest in the centre and at the maximum distance, varying between approximately 20 and 40 per cent. is highest in the central region, where the most chaotic motions are expected, but particles outside of the COAs are a minority at all distances. Fly-by: while retrograde particles are strongly centred and do not exist beyond about 80 kpc, particles on prograde orbits can be found all the way between the two galaxies. Thus, a fly-by can in principle produce prograde tidal debris at all distances between the interacting galaxies. The plot of Pretro shows that only in the inner region retrograde material dominates. As it is formed early, when the two galaxies are still closer to each other, it has lower average apocentres. The lower panel of shows that the majority of all material is found within the COAs, as supported by the strong concentration of the particles in Fig. 4 (right panel). The maximum is found in the inner region, where about 25 per cent of the particles are outside the COAs. See the on-line edition of the article for a colour version of this figure.
Current usage metrics show cumulative count of Article Views (full-text article views including HTML views, PDF and ePub downloads, according to the available data) and Abstracts Views on Vision4Press platform.
Data correspond to usage on the plateform after 2015. The current usage metrics is available 48-96 hours after online publication and is updated daily on week days.
Initial download of the metrics may take a while.