Fig. 5
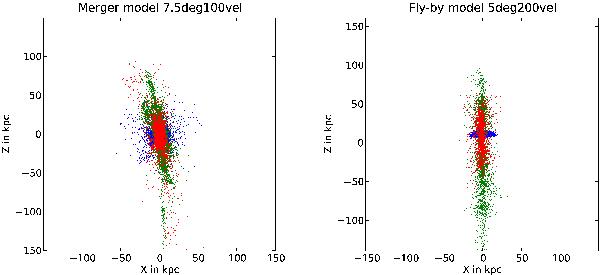
Edge-on views of the tidal debris discs in the merger model 7.5deg100vel (left panel) and the fly-by model 5deg200vel (right panel) at the end of the calculations. Retrograde particles are plotted in red onto prograde particles (green), both are plotted on top of 20 000 particles arbitrarily selected from the target galaxy (blue). In the merger case, only the first 20 000 particles of the pro- and retrograde population are plotted. The tidal debris form a disc around the central galaxy which is oriented in the plane of the interaction. Note that the thickness of the tidal debris distribution is less than the thickness of the MW DoS (Metz et al. 2007; Kroupa et al. 2010). In a less-ideal interaction geometry (e.g. when the infalling disc or the galaxy-orbit is not perfectly perpendicular to the target disc) and through subsequent dynamical evolution, the debris-disc can be expected to be thicker. See the on-line edition of the article for a colour version of this figure.
Current usage metrics show cumulative count of Article Views (full-text article views including HTML views, PDF and ePub downloads, according to the available data) and Abstracts Views on Vision4Press platform.
Data correspond to usage on the plateform after 2015. The current usage metrics is available 48-96 hours after online publication and is updated daily on week days.
Initial download of the metrics may take a while.