Fig. 3
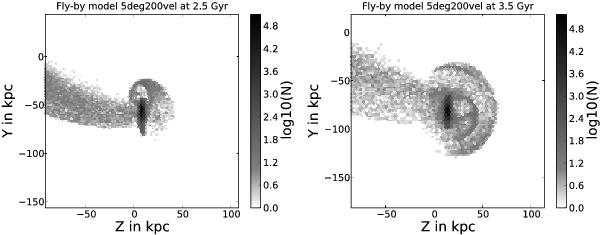
Time evolution of a projection onto the z-y-plane of the particle positions for model 5deg200vel, a typical fly-by. The particle numbers are logarithmically binned. Both plots are centred on the target galaxy. In the left panel the situation at 2.5 Gyr is shown, particles of the infalling galaxy (outside the upper left corner) stream towards the target galaxy (first phase). They pass the target’s centre in the direction of more negative y-axis, defining their orbit to be retrograde. The right panel shows the situation in the second phase at 3.5 Gyr. Now the tidal tail has swept over the centre of the target galaxy and the particles still streaming towards the target pass it on the side of less negative y-axis. They end up on counter-rotating orbits compared to the particles of the first phase. Thus, particles on prograde orbits are formed after the retrograde ones in fly-by encounters.
Current usage metrics show cumulative count of Article Views (full-text article views including HTML views, PDF and ePub downloads, according to the available data) and Abstracts Views on Vision4Press platform.
Data correspond to usage on the plateform after 2015. The current usage metrics is available 48-96 hours after online publication and is updated daily on week days.
Initial download of the metrics may take a while.