Fig. 1
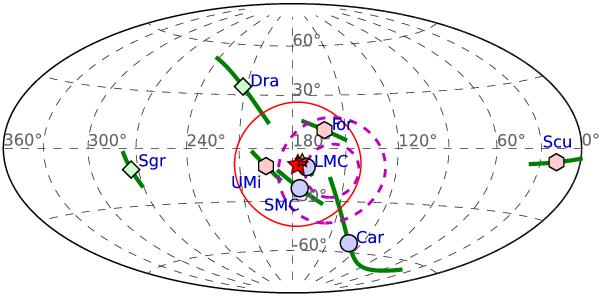
Orbital poles for the eight MW satellite galaxies for which proper motions are measured. The plot is an Aitoff projection of galactocentric coordinates. The green lines give the uncertainties in direction of the orbital poles. The red star marks the mean direction of the orbital poles of the six satellites concentrated in the centre, excluding Sagittarius and Sculptor, the red loop marks the spherical standard deviation. The dashed circles are the regions 15° and 30° degrees from the normal of the DoS fitted to the 11 classical MW satellites. The figure is adapted from Metz et al. (2008). See the on-line edition of the article for a colour version of this figure.
Current usage metrics show cumulative count of Article Views (full-text article views including HTML views, PDF and ePub downloads, according to the available data) and Abstracts Views on Vision4Press platform.
Data correspond to usage on the plateform after 2015. The current usage metrics is available 48-96 hours after online publication and is updated daily on week days.
Initial download of the metrics may take a while.