Fig. 18
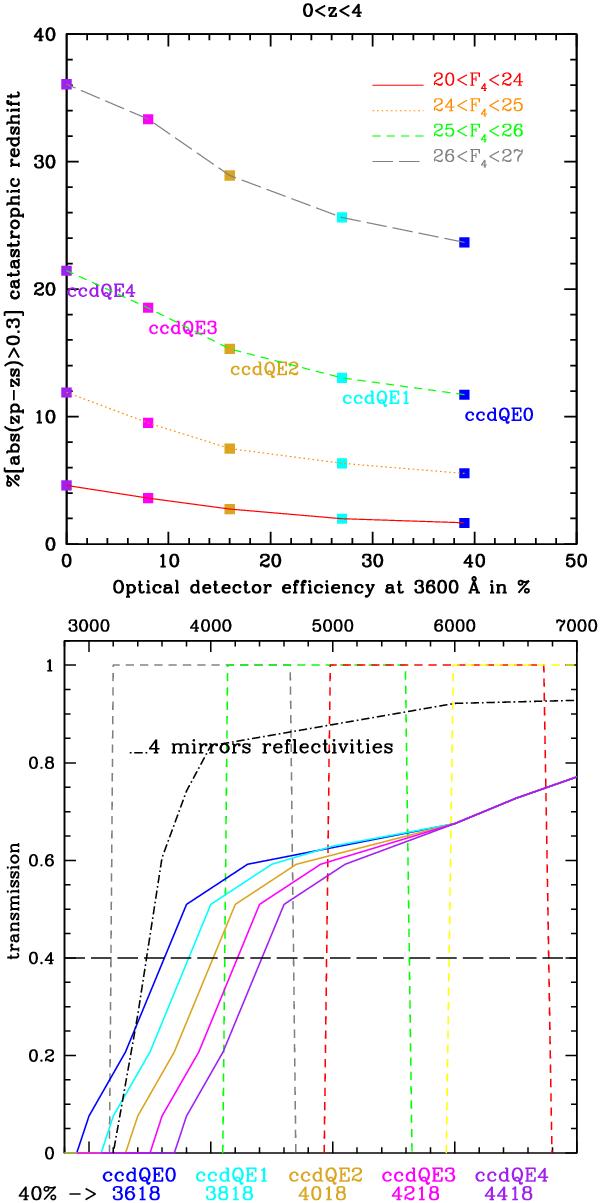
Bottom panel represents the transmission of optical dectectors (solid lines), filters (dahsed lines), and mirror reflectivities (dot-dashed lines) as a function of wavelength in Å. The inscriptions below the bottom figure are the wavelength at 40% efficiency for the different optical detector curves named ccdQEx where x = [0,..,4] . Top panel represents the percentage of catastrophic redshifts as a function of the efficiency of the optical detector at 3600 Å. The colors of points are corresponding to the optical detector of the same color that have been used in the photometric noise calculation.
Current usage metrics show cumulative count of Article Views (full-text article views including HTML views, PDF and ePub downloads, according to the available data) and Abstracts Views on Vision4Press platform.
Data correspond to usage on the plateform after 2015. The current usage metrics is available 48-96 hours after online publication and is updated daily on week days.
Initial download of the metrics may take a while.