Fig. 4
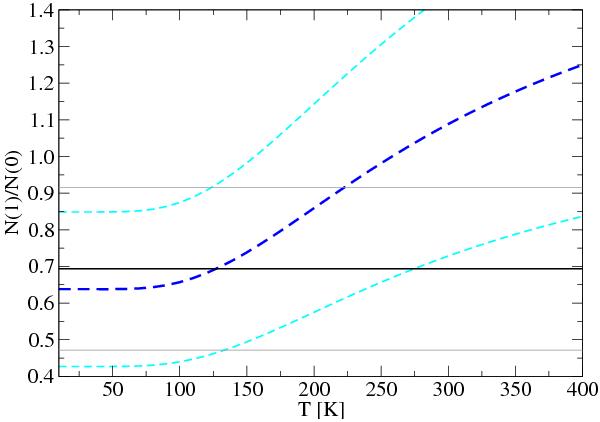
Theoretical N(J = 1)/N(J = 0) ratio on the ν′′ = 0 vibrational level from Eq. (6) shown as a dark blue dashed line. The light blue dashed lines represent errors introduced by the uncertainty of the Northo/Npara H2 ratio 0.64 ± 0.21. The observed N(1)/N(0) ratio is plotted as a straight black line. The N(1)/N(0) uncertainties are shown as straight gray lines.
Current usage metrics show cumulative count of Article Views (full-text article views including HTML views, PDF and ePub downloads, according to the available data) and Abstracts Views on Vision4Press platform.
Data correspond to usage on the plateform after 2015. The current usage metrics is available 48-96 hours after online publication and is updated daily on week days.
Initial download of the metrics may take a while.