Fig. 3
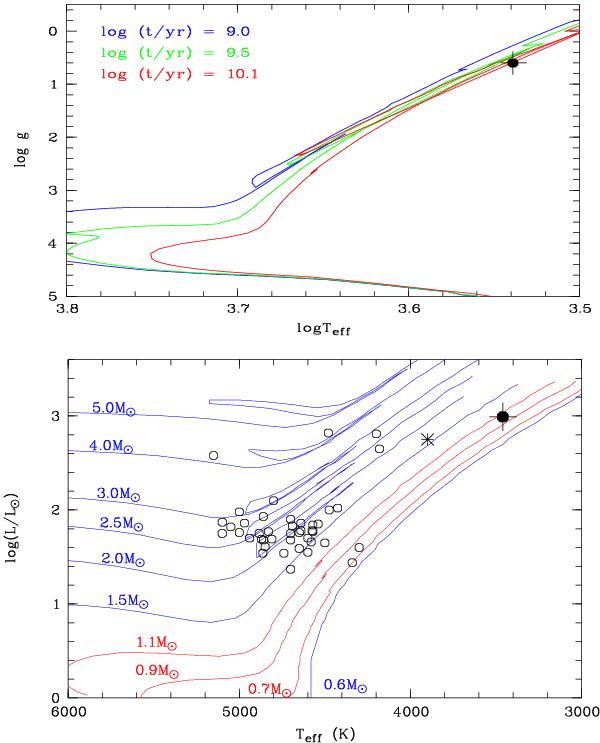
Upper panel. The log g versus log Teff diagram. The Girardi et al. (2000) isochrones for three different ages are overplotted. The black dot represents the position of IRAS 12556–7731. Lower panel. HR diagram of several Li-rich giants. The evolutionary tracks by Girardi et al. (2000) for several masses as labelled are represented with continuous lines. The lithium-rich K-type giants (Kumar et al. 2011) are over-plotted with open circles. The asterisk represents HD 39853, while the position of IRAS 12556–7731 is indicated by the big black dot.
Current usage metrics show cumulative count of Article Views (full-text article views including HTML views, PDF and ePub downloads, according to the available data) and Abstracts Views on Vision4Press platform.
Data correspond to usage on the plateform after 2015. The current usage metrics is available 48-96 hours after online publication and is updated daily on week days.
Initial download of the metrics may take a while.