| Issue |
A&A
Volume 531, July 2011
|
|
|---|---|---|
| Article Number | L10 | |
| Number of page(s) | 4 | |
| Section | Letters | |
| DOI | https://doi.org/10.1051/0004-6361/201117087 | |
| Published online | 24 June 2011 | |
Letter to the Editor
The bi-stability jump as the origin for multiple P-Cygni absorption components in luminous blue variables
1
Max-Planck-Institut fuer Radioastronomie, Auf dem Huegel 69, 53121 Bonn, Germany
e-mail: This email address is being protected from spambots. You need JavaScript enabled to view it.
2 Armagh Observatory, College Hill, Armagh BT61 9DG, Northern Ireland
e-mail: This email address is being protected from spambots. You need JavaScript enabled to view it.
Received: 15 April 2011
Accepted: 23 May 2011
Abstract
Luminous blue variables (LBVs) oftentimes show double-troughed absorption in their strong Hα lines, which are as yet not understood. Intriguingly, the feature has also been seen in the interacting supernova SN 2005gj, which was for this reason suggested to have an LBV progenitor. Our aims are to understand the double-troughed absorption feature in LBVs and investigate whether this phenomenon is related to wind variability. To this purpose, we perform time-dependent radiative transfer modeling using cmfgen. We find that abrupt changes in the wind-terminal velocity – as expected from the bi-stability jump – are required to explain the double-troughed absorption profiles in LBVs. This strengthens scenarios that discuss the link between LBVs and SNe utilizing the progenitor’s wind variability resulting from the bi-stability jump. We also discuss why the presence of double-troughed P-Cygni components may become an efficient tool to detect extra-galactic LBVs and how to analyze their mass-loss history on the basis of just one single epoch of spectral observations.
Key words: stars: winds, outflows / stars: early-type / stars: mass-loss / stars: massive / stars: atmospheres
© ESO, 2011
1. Introduction
Luminous blue variables (LBVs) are unstable massive stars whose evolutionary state is under heavy debate. While they have been thought to be in a short, transitory phase between an O-type and Wolf-Rayet (WR) star (Humphreys & Davidson 1994), recent observations suggest that LBVs might actually be the final stage before the star explodes as a type-II SN (e. g. Kotak & Vink 2006; Smith et al. 2007; Gal-Yam & Leonard 2009).
LBVs are characterized by severe mass loss (~10-6−10-3 M⊙ yr-1), slow winds (terminal speeds ~50−500 km s-1), photometric and spectroscopic S Doradus-type variations on timescales of years, and are often surrounded by circumstellar nebulae (Humphreys & Davidson 1994). During the S Dor-type variations, the stellar radius changes by up to a factor of 10, while the effective temperature changes in the range 8000 − 25 000 K (van Genderen 2001). There is evidence for variability in the bolometric luminosity of up to a factor of two in the few LBVs that have been analyzed in detail with modern radiative transfer codes (Groh et al. 2009; Clark et al. 2009).
During the S-Dor variations, LBVs may eventually cross the so-called bi-stability limit (Vink & de Koter 2002; Groh et al. 2011), which occurs in line-driven winds at around Teff ~ 21 000 K (Lamers et al. 1995; Vink & de Koter 2002). Model predictions by Pauldrach & Puls (1990) suggested that wind bi-stability plays an important role in a shell-ejection scenario of P Cygni, in the sense that small variations (~5%) in L ⋆ or R ⋆ cause significant changes in the wind properties (see also Najarro et al. 1997; Hillier et al. 1998).
Today, bi-stability refers to mass loss and wind-velocity variations resulting from changes in the Fe ionization (Vink et al. 1999). Given that the defining characteristic of LBVs are their S-Dor variations (Humphreys & Davidson 1994), there is an expectation that LBVs could change their mass-loss properties due to the bi-stability whilst they travel back and forth across the upper Hertzsprung-Russell diagram (Vink & de Koter 2002; Lamers 1997). Indeed, Groh et al. (2011) confirmed that the prototype LBV AG Carinae crosses the bi-stability limit, but were unable to identify whether a gradual change or a jump in the wind properties occurs.
It is also the property of having variable mass loss and wind terminal speed that first revealed LBVs as candidate supernova (SN) progenitors (Kotak & Vink 2006). This assertion was strengthened by the detection of double-troughed P Cygni absorption components in the narrow Hα portion of the interacting supernova SN2005gj (Trundle et al. 2008). Such multiple-absorption components have been known, for several decades, to exist in Hα spectra of confirmed LBVs (Fig. 1; e.g., Stahl et al. 1983, 2001, 2003; Leitherer et al. 1994). The phenomenon might be the result of shells ejected by the LBV, or caused by radiative transfer effects (Hillier 1992), or due to variable winds, as would be expected from the physics of the bi-stability jump.
The main aim of this Letter is to explain the origin of the multiple P-Cygni absorption components seen in LBVs. Explaining this phenomenon is particularly relevant as it is as yet far from proven that LBVs really are SN progenitors. A number of hints in this direction have been suggested, but they all have their specific issues (see e.g. Dwarkadas 2011, and references therein). Most significantly, stellar evolution theory does not predict the cores of LBV stars to be advanced enough to be anywhere close to core-collapse (Langer et al. 1994; Meynet & Maeder 2003). It is thus important to scrutinize all suggestions involving a direct link between LBVs and SNe. Before being able to attack the line profiles seen in SN2005gj, which involve the complexities inherent to both progenitor mass loss and the subsequent SNe, it seems logical to first attempt to explain the more widespread existence of multiple absorption components in LBVs themselves.
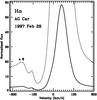 |
Fig. 1 Observed spectrum of the LBV AG Car around Hα obtained in 1997 Feb. 28, from Stahl et al. (2001). The dashed line shows a magnified view (factor of 6) of the double-troughed P-Cygni absorption. |
2. Radiative transfer modeling method
We employ a modified version of the spherical symmetric, fully line-blanketed, non-LTE radiative transfer code cmfgen (Hillier & Miller 1998) to analyze the effects of time-dependent wind parameters on the stellar spectrum. Each model is specified by the hydrostatic core radius R⋆, luminosity L⋆, mass-loss rate Ṁ, wind volume filling factor f, wind terminal velocity v∞, and chemical abundances Zi of the included species. We compute time-dependent models with the following stellar and wind parameters: Teff in the range of 13 000 to 25 000 K, Ṁ in the range of 0.2 to 2 × 10⁻⁵ M⊙ yr-1, M = 60 M⊙, L ⋆ = 106 L⊙, f = 0.25, and chemical abundances typical of LBVs, with a He mass fraction of Y = 0.62, N/N⊙ = 7, C/C⊙ = 0.08, O/O⊙ = 0.025, and solar abundance for the iron group elements. These parameters are roughly characteristic for AG Car.
Here we briefly describe our implementation of time-dependent density and velocity structures. The reader is referred to Groh et al. (2008) and Groh & Hillier (2011, in prep.) for further details. At the moment, no time dependence is accounted for in the solution of the radiative transfer and rate equations, since the recombination timescale is much shorter than the flow timescale for the wind regions studied here. As the wind hydrodynamics is currently not yet solved for, in order to account for time-dependent outflows, we allow for arbitrary v(r) and ρ(r) stratifications as inputs into cmfgen. We consider cases when the star crosses the bi-stability limit, evolving between two epochs: the initial epoch 1, when Teff = 23 000 K and a fast wind is present with v∞,1, and epoch 2, when Teff decreases and a slow wind is present, according to v∞,2 < v∞,1. For simplicity, we keep Ṁ fixed, so that ρ(r) is computed following the equation of mass conservation.
We explore two scenarios as to whether the double P-Cygni profiles can be caused by the time variability of wind parameters: a gradual change in v∞, or an abrupt instantaneous variability.
For models with gradual changes in v∞(t), for simplicity we assume that, starting at t = 0, v∞ decreases linearly with time. For a given time Δt after t = 0, we compute the distance traveled by material ejected between t = 0 and Δt. The result is a velocity law that increases linearly with the distance up to a point where the initial wind is reached. From that point onwards, v(r) follows the standard β-type, asymptotically reaching v∞,1 (Fig. 2a).
For models with an abrupt change, we assume that at t = 0, v∞ switches instantaneously from v∞,1 to v∞,2. To compute a model for a given Δt, we evaluate the distance traveled by the last particles of the initial wind (r1), as well as the distance traveled by the first particles of the final wind (r2). Following a suggestion by Owocki (2010, priv. comm.), we assume that the initial wind characterizes the region from r1 up to the outer boundary of the computational domain, whilst a β-type law characterized by v∞,1 and β1 is assumed. From the star up to r2, we assume that v(r) is given by the velocity law of the final wind according to v∞,2 and β2. We further assume that the region in between the two winds, i.e. between r2 and r1, v(r) and ρ(r) are linear, and join the two winds smoothly. We defer to future hydrodynamical computations for a more accurate treatment of this region, but we note that initial tests using somewhat different assumptions may lead to small changes in the resulting P-Cygni line profiles. These changes are not anticipated to affect the conclusions reached here.
For both gradual and abrupt models, we assume that the stellar wind is at t = 0 in steady-state with v∞,1 = 150 km s-1 and β1 = 1 and, as t → ∞, evolves to a final state with v∞,2 = 70 km s-1 and β2 = 1. The choice of v∞ values is based on LBV spectral data, whilst the factor of two change in v∞ is adopted from theoretical predictions (Vink et al. 1999).
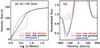 |
Fig. 2 a) Wind velocity law for a time-dependent model at Δt = 120 days with a gradual change in v∞(t) (black solid line) and with a abrupt change in v∞(t) (red dashed line), in comparison to a steady-state model (blue dash dotted line). b) Corresponding Hα line profiles. |
3. Time-dependent P-Cygni line profiles: gradual vs. abrupt changes in the wind parameters
Figure 2b presents the P-Cygni line profiles calculated for both a gradual and an abrupt variation of the wind parameters as a function of time, here computed at Δt = 120 days. A gradual change in v∞(t) causes a linear variation of the velocity with distance (Fig. 2a). At Δt = 120 days, the P-Cygni profile deviates only slightly from a steady-state model with the same stellar parameters. To test the robustness of our results, we computed models for different Δt, as well as stellar and wind parameters all with gradual changes, but we still could not obtain double P-Cygni absorption components.
On the other hand, we found that an abrupt change in v∞ causes significant effects in the wind velocity law (Fig. 2a). While the velocity law of the outer wind is similar to that of the gradually changing as well as steady-state models, the inner part of the wind follows a β-type law asymptotically approaching v∞,2. The abrupt change in v∞ modifies not only the velocity and density structures, but also causes the appearance of a double-troughed P-Cygni absorption component (Fig. 2b). The double P-Cygni absorption component arises as a result of the presence of a small amount of material with velocities in between v∞,1 and v∞,2, causing a very low Hα line opacity between these two velocities. Models computed with a variable Ṁ across the bi-stability jump show a similar qualitative behavior as the ones shown here, implying the abrupt change in v∞ is the key phenomenon responsible for the double-troughed P-Cygni absorption components. We are not able to tell whether there is a jump in Ṁ as well.
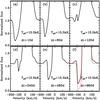 |
Fig. 3 Variations of the synthetic Hα line profiles as a function of Δt for a fixed Teff = 15.5 kK and Ṁ = 9 × 10⁻⁶ M⊙ yr-1. The red dashed line in panel f) corresponds to the steady-state profile obtained as t → ∞. |
Figure 3 presents the temporal evolution of the Hα absorption profile for selected Δt, showcasing how the absorption evolves from the initial fast wind in steady-state (panel a) to the final slow wind in steady-state (panel f, red dashed line). We find that the P-Cygni absorption component from the fast wind becomes weaker, as the slow wind takes over, disappearing at around Δt = 240 days. The P-Cygni absorption component from the slow wind first appears rather weakly at around Δt = 90 days, and increases in strength as a function of time. Note that even when no absorption from the fast wind is seen, its weak emission still influences the spectral morphology, even at Δt = 960 days.
So when can the double P-Cygni absorption components be seen after the abrupt change in v∞? The duration of the double P-Cygni absorption period depends on the characteristic flow time (dependent on R⋆/v∞ and β) of both winds, as well as on the location of the line forming region of interest. For the parameter space explored here, Hα forms at a distance from ~2 to 10 R ⋆ , and the double P-Cygni absorption component is seen from Δt around 90 to 180 days, with its maximum strength around 120 days. Higher values of β increase the flow timescale and allow the double P-Cygni absorption components to be observed during a more extended period of time.
4. The dependence of the double P-Cygni absorption profiles on Teff and 
An abrupt change in v∞ is required to reproduce double P-Cygni absorption profiles (Fig. 2). The next relevant question is: for which range of stellar and wind parameters does a double P-Cygni absorption profile appear in Hα?
Here we focus on changes in Teff and Ṁ, keeping the other stellar and wind parameters constant as well as Δt = 120 days. We found that the morphology of the double P-Cygni absorption profiles is strongly sensitive to both Teff and Ṁ, and that a zoo of absorption line profiles are predicted by our models (Fig. 4).
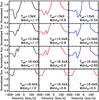 |
Fig. 4 Variations of the synthetic Hα line profiles as a function of Teff (in kK) and Ṁ (in units of 10-5 M⊙ yr-1), at Δt = 120 days. |
We note that an increase in Teff from 13 000 K to 18 400 K causes less absorption by the initial, fast wind, resulting in weaker high-velocity absorption components. Models with Teff > 18 400 K have H ionized throughout the wind, which dramatically reduces the population of the n = 2 level related to the Hα absorption. As a consequence, these hotter models show extremely weak or no P-Cygni absorption, since the time-dependent velocity structure is not probed by Hα if H is ionized throughout the wind.
In addition, our model predict weak blue-shifted emission between the two absorption components. This blue-shifted emission arises in the initial, fast wind, from non-core rays. According to our models, the intensity of the blue-shifted emission increases as Teff increases.
Perhaps surprisingly, our models predict that, for a given L ⋆ and Teff, double-troughed P-Cygni absorption appears in Hα only for a relatively narrow range of Ṁ. We found that there is an optimal value of Ṁ (Ṁopt) when the contrast between the two absorption components is maximal. The double-troughed P-Cygni absorptions are present when Ṁ is about ~± 30% around Ṁopt. For Teff < 18 000 K, we found four possible regimes of the Hα absorption morphology (Fig. 5), depending on Ṁ:
-
Ṁ > 1.3 Ṁopt: absorption from the fast wind only, since the emission from the fast wind from non-core rays fills out the absorption from the slow wind;
-
0.7 Ṁopt < Ṁ < 1.3 Ṁopt: double P-Cygni absorption, i.e. absorption from both winds;
-
0.3 Ṁopt < Ṁ < 0.7 Ṁopt: absorption from the slow wind only since, for lower Ṁ, the fast wind is not optically-thick enough in Hα to produce detectable absorption;
-
Ṁ < 0.3 Ṁopt: no P-Cygni absorption, since both winds are not optically-thick enough in Hα.
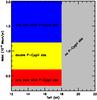 |
Fig. 5 Morphology of the Hα P-Cygni absorption component in LBVs as a function of Ṁ and Teff, at Δt = 120 days. |
5. Discussion
We demonstrated via time-dependent, radiative transfer modeling with cmfgen that abrupt wind-velocity changes are needed to reproduce the observed double P-Cygni absorption components seen in a plethora of LBV spectra. The most promising manner causing such abrupt changes in v∞ is by means of the bi-stability jump, as discussed in Vink & de Koter (2002).
We reinforce that the modeling performed here is not exhaustive, given the vast parameter space to be explored and the model limitations. For instance, the full hydrodynamics and time-dependent solution of the radiative transfer and statistical equilibrium equations are not yet accounted for. Furthermore, we consider an idealized scenario of an instantaneous abrupt change in v∞, whereas in reality, the changes could occur over extended time periods of days or weeks. Constraints on the timescale could be obtained via time-dependent modeling of observational data of LBVs that actually cross the bi-stability limit, e.g. AG Car. These topics will be the subject of future studies.
We note that the empirical identification of a luminous massive star as a bona-fide member of the LBV class is a challenging exercise. This is mainly due to the long timescales (years to decades) necessary to monitor the irregular spectral variability. As the detection of double P-Cygni absorption components is a strong indication that the candidate object is an LBV undergoing S-Dor type variability cycles – with its abrupt changes in v∞ on timescales of years – we suggest that the sheer presence of such double P-Cygni absorption components may become an efficient, novel way to detect Galactic and extra-galactic LBVs.
We found that the morphology of the double P-Cygni absorption components depends strongly on Ṁ and Teff. This opens up the possibility to constrain these quantities without the lengthy process of non-LTE radiative transfer modeling: once L⋆ is known, for given Δt, v∞,1, and v∞,2 could be derived empirically.
If observations at multiple epochs are available, we should also be able to trace the LBV mass-loss history using a similar modeling strategy as employed here, as the Hα line forms over an extended stellar-wind region in LBVs. This will allow us to use the double P-Cygni absorption components as a tool to look back in time, and to be able to estimate LBV stellar parameters from one single epoch. Although in this Letter we focused on Hα, motivated by the observational data available, we note that our time-dependent models predict similar double-troughed P-Cygni absorption in many other spectral lines formed at different wind regions, such as most of the Balmer lines, Fe ii, N ii, He i λ10830, among others. Analyses of these lines should lead to a much improved understanding of the mass-loss history of LBVs.
Interestingly, the morphology of the absorption-line profiles seen in Fig. 4 closely resemble those found in the interacting SN 2005gj (Trundle et al. 2008). This strengthens the link between LBVs and SNe that based their assertions on the bi-stability mechanism during S Dor cycles (Kotak & Vink 2006; Trundle et al. 2008), and the LBV/SN link in general (Smith et al. 2007; Gal-Yam & Leonard 2009). We expect that our results will encourage further observational and modeling efforts to establish under which conditions LBVs explode as SNe.
Acknowledgments
We thank John Hillier for making CMFGEN available. We acknowledge discussions with Rubina Kotak, Stan Owocki, and Tom Madura. J.H.G. is thankful for the warm hospitality during his visit to Armagh Observatory.
References
- Clark, J. S., Crowther, P. A., Larionov, V. M., et al. 2009, A&A, 507, 1555 [NASA ADS] [CrossRef] [EDP Sciences] [Google Scholar]
- Dwarkadas, V. V. 2011, MNRAS, 412, 1639 [NASA ADS] [CrossRef] [Google Scholar]
- Gal-Yam, A., & Leonard, D. C. 2009, Nature, 458, 865 [NASA ADS] [CrossRef] [PubMed] [Google Scholar]
- Groh, J. H., Hillier, D. J., & Damineli, A. 2008, in Clumping in Hot-Star Winds, ed. W.-R. Hamann, A. Feldmeier, & L. M. Oskinova, 59 [Google Scholar]
- Groh, J. H., Hillier, D. J., Damineli, A., et al. 2009, ApJ, 698, 1698 [NASA ADS] [CrossRef] [Google Scholar]
- Groh, J. H., Hillier, D. J., & Damineli, A. 2011, ApJ, in press [arXiv:1105.0814] [Google Scholar]
- Hillier, D. J. 1992, in The Atmospheres of Early-Type Stars, ed. U. Heber, & C. S. Jeffery (Berlin: Springer Verlag), Lect. Not. Phys., 401, 105 [Google Scholar]
- Hillier, D. J., & Miller, D. L. 1998, ApJ, 496, 407 [NASA ADS] [CrossRef] [Google Scholar]
- Hillier, D. J., Crowther, P. A., Najarro, F., & Fullerton, A. W. 1998, A&A, 340, 483 [NASA ADS] [Google Scholar]
- Humphreys, R. M., & Davidson, K. 1994, PASP, 106, 1025 [NASA ADS] [CrossRef] [Google Scholar]
- Kotak, R., & Vink, J. S. 2006, A&A, 460, L5 [NASA ADS] [CrossRef] [EDP Sciences] [Google Scholar]
- Lamers, H. J. G. L. M. 1997, in Luminous Blue Variables: Massive Stars in Transition, ASP Conf. Ser., 120, 76 [Google Scholar]
- Lamers, H. J. G. L. M., Snow, T. P., & Lindholm, D. M. 1995, ApJ, 455, 269 [NASA ADS] [CrossRef] [Google Scholar]
- Langer, N., Hamann, W.-R., Lennon, M., et al. 1994, A&A, 290, 819 [NASA ADS] [Google Scholar]
- Leitherer, C., Allen, R., Altner, B., et al. 1994, ApJ, 428, 292 [Google Scholar]
- Meynet, G., & Maeder, A. 2003, A&A, 404, 975 [NASA ADS] [CrossRef] [EDP Sciences] [Google Scholar]
- Najarro, F., Hillier, D. J., & Stahl, O. 1997, A&A, 326, 1117 [NASA ADS] [Google Scholar]
- Pauldrach, A. W. A., & Puls, J. 1990, A&A, 237, 409 [NASA ADS] [Google Scholar]
- Smith, N., Li, W., Foley, R. J., et al. 2007, ApJ, 666, 1116 [NASA ADS] [CrossRef] [Google Scholar]
- Stahl, O., Wolf, B., Klare, G., et al. 1983, A&A, 127, 49 [NASA ADS] [Google Scholar]
- Stahl, O., Jankovics, I., Kovács, J., et al. 2001, A&A, 375, 54 [NASA ADS] [CrossRef] [EDP Sciences] [Google Scholar]
- Stahl, O., Gäng, T., Sterken, C., et al. 2003, A&A, 400, 279 [NASA ADS] [CrossRef] [EDP Sciences] [Google Scholar]
- Trundle, C., Kotak, R., Vink, J. S., & Meikle, W. P. S. 2008, A&A, 483, L47 [NASA ADS] [CrossRef] [EDP Sciences] [Google Scholar]
- van Genderen, A. M. 2001, A&A, 366, 508 [NASA ADS] [CrossRef] [EDP Sciences] [Google Scholar]
- Vink, J. S., & de Koter, A. 2002, A&A, 393, 543 [NASA ADS] [CrossRef] [EDP Sciences] [Google Scholar]
- Vink, J. S., de Koter, A., & Lamers, H. J. G. L. M. 1999, A&A, 350, 181 [NASA ADS] [Google Scholar]
All Figures
|
Fig. 1 Observed spectrum of the LBV AG Car around Hα obtained in 1997 Feb. 28, from Stahl et al. (2001). The dashed line shows a magnified view (factor of 6) of the double-troughed P-Cygni absorption. |
| In the text | |
|
Fig. 2 a) Wind velocity law for a time-dependent model at Δt = 120 days with a gradual change in v∞(t) (black solid line) and with a abrupt change in v∞(t) (red dashed line), in comparison to a steady-state model (blue dash dotted line). b) Corresponding Hα line profiles. |
| In the text | |
|
Fig. 3 Variations of the synthetic Hα line profiles as a function of Δt for a fixed Teff = 15.5 kK and Ṁ = 9 × 10⁻⁶ M⊙ yr-1. The red dashed line in panel f) corresponds to the steady-state profile obtained as t → ∞. |
| In the text | |
|
Fig. 4 Variations of the synthetic Hα line profiles as a function of Teff (in kK) and Ṁ (in units of 10-5 M⊙ yr-1), at Δt = 120 days. |
| In the text | |
|
Fig. 5 Morphology of the Hα P-Cygni absorption component in LBVs as a function of Ṁ and Teff, at Δt = 120 days. |
| In the text | |
Current usage metrics show cumulative count of Article Views (full-text article views including HTML views, PDF and ePub downloads, according to the available data) and Abstracts Views on Vision4Press platform.
Data correspond to usage on the plateform after 2015. The current usage metrics is available 48-96 hours after online publication and is updated daily on week days.
Initial download of the metrics may take a while.