| Issue |
A&A
Volume 531, July 2011
|
|
|---|---|---|
| Article Number | A152 | |
| Number of page(s) | 17 | |
| Section | Extragalactic astronomy | |
| DOI | https://doi.org/10.1051/0004-6361/201116998 | |
| Published online | 05 July 2011 | |
Spectroscopic versus photometric metallicities: Milky Way dwarf spheroidal companions as a test case
1
Astronomisches Rechen-Institut, Zentrum für Astronomie der Universität Heidelberg, Mönchhofstrasse 12-14, 69120 Heidelberg, Germany
e-mail: This email address is being protected from spambots. You need JavaScript enabled to view it.
; This email address is being protected from spambots. You need JavaScript enabled to view it.
2
University of Leicester, Department of Physics and Astronomy, University Road, LE1 7RH Leicester, UK
e-mail: This email address is being protected from spambots. You need JavaScript enabled to view it.
3
Landessternwarte, Zentrum für Astronomie der Universität Heidelberg, Koenigstuhl, 69117 Heidelberg, Germany
Received: 31 March 2011
Accepted: 21 May 2011
Abstract
Aims. The method of deriving photometric metallicities using red giant branch stars is applied to resolved stellar populations under the common assumption that they mainly consist of single-age old stellar populations. We explore the effect of the presence of mixed-age stellar populations on deriving photometric metallicities.
Methods. We use photometric data sets for the five Galactic dwarf spheroidals Sculptor, Sextans, Carina, Fornax, and Leo II in order to derive their photometric metallicity distribution functions from their resolved red giant branches using isochrones of the Dartmouth Stellar Evolutionary Database. We compare the photometric metallicities with published spectroscopic metallicities based on the analysis of the near-infrared Ca triplet (Ca T), both on the metallicity scale of Carretta & Gratton and on the scale defined by the Dartmouth isochrones. In addition, we compare the photometric metallicities with published spectroscopic metallicities based on spectral synthesis and medium-resolution spectroscopy, and on high resolution spectra where available.
Results. The mean properties of the spectroscopic and photometric metallicity samples are comparable within the intrinsic scatter of each method although the mean metallicities of dSphs with pronounced intermediate-age population fractions may be underestimated by the photometric method by up to a few tenths of dex in [Fe/H]. The star-by-star differences of the spectroscopic minus the photometric metallicities show a wide range of values along the fiducial spectroscopic metallicity range, with the tendency to have systematically lower photometric metallicities for those dwarf spheroidals with a higher fraction of intermediate-age populations. Such discrepancies persist even in the case of the purely old Sculptor dSph, where one would naïvely expect a very good match when comparing with medium or low resolution metallicity measurements. Overall, the agreement between Ca T metallicities and photometric metallicities is very good in the metallicity range from ~ −2 dex to ~ −1.5 dex. We find that the photometric method is reliable in galaxies that contain small (less than 15%) intermediate-age stellar fractions. Therefore, in the presence of mixed-age stellar populations, one needs to quantify the fraction of the intermediate-age stars in order to assess their effect on determining metallicities from photometry alone. Finally, we note that the comparison of spectroscopic metallicities of the same stars obtained with different methods reveals similarly large discrepancies as the comparison with photometric metallicities.
Key words: galaxies: dwarf / galaxies: stellar content / Local Group / galaxies: abundances
Fellow of the Heidelberg Graduate School of Fundamental Physics (HGSFP) and member of the International Max Planck Research School (IMPRS) for Astronomy & Cosmic Physics at the University of Heidelberg.
© ESO, 2011
1. Introduction
There are several techniques one can use to derive the photometric metallicities of a stellar system using its resolved old red giant branches (RGBs). These include the use of the (V − I)0 color of the RGB stars at the luminosity corresponding to MI = − 3.0 mag or MI = −3.5 mag in conjunction with the empirical relations defined in Da Costa & Armandroff (1990, DA90), in Armandroff et al. (1993), and in Lee et al. (1993); the use of the fiducial ridge lines or analytic functions (Saviane et al. 2000a) describing the mean locus in color-magnitude space of red giants in Galactic globular clusters (GCs) with known metal abundances; as well as the use of theoretical stellar tracks or isochrones. The latter two techniques serve to either bracket the range of the metal abundances or to interpolate between them in order to derive the metallicity distribution function. Examples using the mean color of the RGB can be found in Mould et al. (1983), Caldwell et al. (1998), Grebel & Guhathakurta (1999), Caldwell (2006); using GC fiducials or analytic fits of GC fiducial loci in Harris et al. (1999), Sarajedini et al. (2002); using interpolation between theoretical tracks or isochrones in Harris & Harris (2000), Mouhcine et al. (2005), Crnojevic et al. (2010), Bird et al. (2010), Lianou et al. (2010). In the case of GCs, dwarf spheroidals (dSphs), and the stellar haloes of galaxies, the assumption under which these techniques are used is that the red giants represent populations of an old age (≥ 10 Gyr). For such old populations, a star’s locus in color-magnitude space is primarily sensitive to metallicity, while age spreads only produce a small color spread (Grebel 1997; Frayn & Gilmore 2002).
The case of the Local Group (LG) dwarf galaxies has shown that all dwarfs studied in detail so far contain a population of old stars (e.g., Grebel 2001; Grebel & Gallagher 2004). Some of these systems contain intermediate-age populations as well (from 1 Gyr up to less than 10 Gyr) in addition to early star formation, thus presenting rather complex star formation histories (SFH; Grebel 1997; Mateo 1998; Tolstoy et al. 2009). In particular, this is the case for dwarf irregulars (dIrrs), transition-type dwarfs (dIrr/dSphs), dwarf ellipticals (dEs) and the many of the more luminous dSphs. Although spectroscopic observations of individual stars provide the best means to reveal and break an age-metallicity degeneracy along the RGB in systems with complex SFHs, as for instance in the case of Carina (Smecker-Hane et al. 1994; Koch et al. 2006), such studies are limited to nearby objects within the LG due to the faintness of the stars to be targeted and due to crowding. Based on the fact that many of the LG dSphs show complex SFHs, the assumption of a single old age for their stellar populations does not hold. In dwarf galaxies in more distant systems there are clear indications of complex SFHs as well (as traced by, e.g., broad RGBs or the presence of luminous asymptotic giant branch stars, red clump stars and occasionally even luminous blue main sequences) but more detailed information about their SFHs is not available. Moreover, in these more distant systems spectroscopy of individual stars along the RGB is not feasible with present-day instruments. Thus it is worth exploring how the assumption of a single old age affects the photometrically derived metallicities of composite populations with a range of ages.
In the present work we perform a comparison of the mean metallicity properties as well as a direct star-by-star comparison between the spectroscopically and the photometrically derived metallicities. For individual star comparisons, we use the stars in common to both photometric and spectroscopic samples of Galactic dSph companions that have been studied in the literature. In order to perform such a star-by-star comparison, we use results for five Galactic dSphs, namely Carina, Leo II, Fornax, Sextans, and Sculptor. The three dSphs Carina, Leo II, and Fornax have complex star formation and chemical enrichment histories with different fractions of intermediate-age stellar populations, while Sextans and Sculptor are dominated by old populations.
This paper is structured as follows. In Sect. 2 we present the spectroscopic and photometric datasets we use. In Sect. 3 we show our results on the comparison of the mean metallicity properties as well as on the star-by-star comparison. In Sect. 4 we discuss our main findings and in Sect. 5 we present our summary and conclusions.
2. Data
2.1. Our dwarf spheroidal galaxy sample
The dSph sample was selected such that there are both spectroscopic metallicities and photometric results available in the literature. The adopted galaxies are the five Galactic dSphs Sculptor, Sextans, Carina, Fornax, and Leo II, which show a diversity in their SFHs.
More specifically, in the case of Sculptor and Sextans the dominant population is of an old age (e.g., Hurley-Keller et al. 1999; Monkiewicz et al. 1999, for Sculptor; Lee et al. 2003; 2009, for Sextans). Sculptor shows two distinct old stellar components in terms of metallicity and kinematics (e.g., Tolstoy et al. 2004), as well as a metallicity gradient (Harbeck et al. 2001). De Boer et al. (2011) suggest that Sculptor stopped forming stars 7 Gyr ago. Sextans shows a population gradient based on its horizontal branch morphology (Harbeck et al. 2001), as well as a metallicity gradient, where the metal-rich stars are more centrally concentrated and have colder kinematics than the metal-poor ones (Battaglia et al. 2011).
Carina experienced episodic star formation with at least three distinct populations separated by quiescent phases lasting about 4 Gyr (Smecker-Hane et al. 1994; Smecker-Hane et al. 1996; Mighell 1997; Hurley-Keller et al. 1998; Monelli et al. 2003). The majority of the stars of Carina formed around 7 Gyr ago (Hurley-Keller et al. 1998; Rizzi et al. 2003). Carina shows a mild radial metallicity gradient in the sense that the metal-rich population is more centrally concentrated (Koch et al. 2006). A similar trend is observed with respect to age such that the intermediate-age populations are more centrally concentrated (Harbeck et al. 2001; Monelli et al. 2003). Leo II has both old and intermediate-age populations (Aaronson & Mould 1985; Lee 1995; Mighell & Rich 1996; Gullieuszik et al. 2008). It appears that there is no significant metallicity gradient present in Leo II (Koch et al. 2007). In the case of Fornax, the dominant population is of an intermediate-age (ca. 3–4 Gyr; Coleman & de Jong 2008) and it also contains old and a young populations (Stetson et al. 1998; Saviane et al. 2000b), while showing a strong radial metallicity gradient (Battaglia et al. 2006).
Global properties.
The global properties of the five dSphs, sorted by increasing distance modulus, are listed in Table 1. We show in Col. (1) the galaxy name; in Cols. (2) and (3) the V- and I-band extinctions, respectively; in Col. (4) the distance modulus; in Col. (5) the I-band magnitude of the tip of the RGB (TRGB).
2.2. Spectroscopic metallicities and metallicity scales
The spectroscopic metallicities of individual stars in dSphs can be inferred either directly by high-resolution measurements of iron abundances, [Fe/H], from individual Fe lines, or through low / medium resolution spectroscopic measurements based on different spectral indicators. The latter method is the one widely used since it has the potential of providing spectra for a large number of stars within a reasonable integration time.
2.2.1. Ca II triplet
One way to infer the overall spectroscopic metallicities (strictly speaking [M/H], however usually also denoted as [Fe/H]) is from the strength of the Ca II triplet (Ca T) lines at 8498 Å, 8542 Å and 8662 Å. The measured property is the sum of the equivalent widths, ΣW, either of two or of a combination of all three Ca T lines (e.g., Starkenburg et al. 2010). This is then used to derive the reduced equivalent width, W′, using empirical calibrations between the ΣW and (V − VHB), defined, e.g., in Armandroff & Da Costa (1991, hereafter AD91). VHB is the V-band magnitude of the horizontal branch. The calibration of ΣW as a function of (V − VHB) is chosen because it removes, to first order, any dependencies on stellar gravity, reddening, and distance uncertainties (e.g., AD91). The width W′ is then used to derive a metallicity, commonly based on a calibration of Galactic GCs with known spectroscopic iron abundances.
The Galactic GC metallicities are derived in various different ways. Thus, several metallicity scales have been defined so far, which include the Zinn & West (1984, hereafter ZW84), the Carretta & Gratton (1997, hereafter CG97), the Kraft & Ivans 2003, hereafter KI03) and the Carretta et al. (2009, hereafter CBG09) metallicity scales. The first one uses metallicity sensitive spectrophotometric indices of the integrated light of Galactic GCs, while the latter three use high resolution spectroscopic measurements of Galactic GC red giants to infer their iron abundance from individual Fe i and Fe ii lines.
Commonly used sets of such calibrations are given in AD91 and Da Costa & Armandroff (1995) for the ZW84 metallicity scale, and by Rutledge et al. (1997, hereafter R97) for both the ZW84 and CG97 metallicity scales. Among these calibrations, the definition of the Ca T sum of the equivalent widths, ΣW, is different, depending on how many lines were used and with what weight. KI03 provide a similar calibration between their scale of Fe II-based abundances and the reduced widths W′ of GCs, and so do CBG09.
The Ca T method was initially calibrated via Galactic GCs, which are old populations and to first order simple stellar populations of a single metallicity. They have a different chemical enrichment history than the dSphs (AD91; Venn et al. 2004; Koch et al. 2008a,b). Subsequently, Cole et al. (2004) extended this method to much younger ages down to 2.5 Gyr by including younger open and populous clusters in the Milky Way and in the Large Magellanic Cloud, while Carrera et al. (2007) used Galactic open and globular clusters to further extend the method to ages as young as 0.25 Gyr. The Ca T method is widely used to derive the metallicities of galaxies that have more complex star formation and chemical enrichment histories than those of the calibrating Galactic GCs and populous clusters. The implications of the different chemical enrichment and star formation history in the dSphs and the Galactic GCs for the Ca T method have been discussed in Da Costa & Hatzidimitriou (1998), Cole et al. (2000; 2004), Pont et al. (2004), Bosler et al. (2007), Carrera et al. (2007), Battaglia et al. (2008b) and Koch et al. (2008a). Cole et al. (2004) have shown that the effect of age on the metallicity calibration is negligible as compared to the intrinsic scatter of the Ca T method for the metallicity ranges on the CG97 metallicity scale between − 2.0 and −0.2 dex in [Fe/H], while Carrera et al. (2007) extended this metallicity range for three metallicity scales between −2.2 dex to +0.47 dex. At lower metallicities there is an overestimate of the Ca T metallicities as compared with metallicities derived from high-resolution measurements (e.g., Battaglia et al. 2008b; Koch et al. 2008a). Therefore recent efforts focused on extending the scale to even lower metallicities. Starkenburg et al. (2010) recalibrated the empirical relation between Ca T equivalent width and metallicity, extending the validity range of the Ca T method to −4 dex. Overall, the method can now be used to infer the metallicities of red giants within a metallicity range of −4 dex ≤ [Fe/H] ≤ + 0.47 dex and an age range of 0.25 Gyr ≤ age ≤ 13 Gyr (Cole et al. 2004; Carrera et al. 2007; Starkenburg et al. 2010).
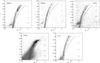 |
Fig. 1 Color–magnitude diagrams of the five Galactic dSphs, shown as small grey dots. Dartmouth isochrones are overplotted as solid lines, for a fixed age of 12.5 Gyr, a range in metallicities from −2.5 to −1 dex, and a step size of 0.5 dex. The thick black dots correspond to the stars in common to the photometric and Ca T-based spectroscopic sample. The error bars correspond to the photometric errors. In the CMD of Sculptor, the red and blue asterisks indicate the location of the extremely metal-poor stars with a high-resolution iron abundance of −3.96 dex and −3.48 dex, respectively, identified by Tafelmeyer et al. (2010; red: Scl 07–50; blue: Scl 07–49), while the photometric metallicities obtained for the same stars are −2.55 dex and −2.71 dex, respectively. In the CMD of Fornax, again the red asterisk indicates the location of the extremely metal-poor star with a high-resolution iron abundance of − 3.66 dex (Tafelmeyer et al. 2010; Frx 05–42), while the photometric metallicity assigned to the same star is − 2.98 dex. |
2.2.2. Medium-resolution combined with spectral synthesis
An alternative method to infer the metallicity of individual stars relies on medium-resolution stellar spectra (R ~ 6500 at 8500 Å) in combination with spectral synthesis (Kirby et al. 2008). A plethora of individual absorption lines within a broad spectral range from 6400 Å to 9000 Å is used in a Bayesian approach, where the observed spectra are compared to a grid of synthetic stellar spectra with a range of Teff, log g, and composition. The adopted metallicity for each individual star is the metallicity of the best-fit template spectrum to the observed one. This technique is different from the Ca T method, in the sense that the entire available spectroscopic features in the observed spectrum are used, not only to derive the metallicity, but also to simultaneously pinpoint all stellar parameters (effective temperature, surface gravity, and an empirical microturbulence). We note that the spectral resolution of this method is equivalent to the one of the Ca T method. A complete description of the medium-resolution method is given in Kirby et al. (2010, and references therein), while possible systematics affecting the derived metallicities as well as a comparison with high-resolution spectroscopic metallicities are discussed in Kirby et al. (2009; 2010).
2.3. Spectroscopic sample
We use two sources for the spectroscopic metallicities, both adopted from available literature data.
The first spectroscopic sample consists of Ca T-based spectroscopic metallicities for all five dSphs. For Carina, the Ca T data are adopted from Koch et al. (2006), for Leo II from Koch et al. (2007), for Fornax from Battaglia et al. (2006), for Sextans from Battaglia et al. (2011, and priv. comm.), and for Sculptor from Battaglia et al. (2008b). We refer to these publications for the description of the spectroscopic observations and analysis. In all cases, the strength of the Ca T lines is used as a metallicity indicator for the individual red giant stars from either low or medium resolution spectroscopy. The spectroscopic metallicities for Carina, Leo II, Fornax and Sculptor are inferred through the calibration in the sense of R97, while for Sextans the calibration defined in Starkenburg et al. (2010) is used. The main difference between the calibration in Starkenburg et al. (2010) and in the earlier calibrations is that in the new calibrations the relation between metallicity and line strength is not linear, while it is in the earlier calibrations. In addition, the Starkenburg et al. (2010) calibration is valid for metallicities from − 4 dex to − 0.5 dex, while the previous ones are calibrated from − 2 dex to − 0.2 dex (see Cole et al. 2004). In the following, all the Ca T-based spectroscopic metallicities mentioned are given on the CG97 metallicity scale, as originally provided in the literature.
The second spectroscopic sample refers to spectroscopic metallicities derived using medium-resolution spectroscopy (MRS) combined with spectral synthesis and adopted from Kirby et al. (2010). Their dSph sample includes MRS metallicities for Sculptor, Sextans, Fornax, and Leo II. We refer to Kirby et al. (2010; 2009) and Kirby et al. (2008) for the description of the spectroscopic observations and analysis of the method. We note that the MRS metallicities form a metallicity scale of their own.
2.4. Photometric sample
The photometry of Carina, Fornax and Sculptor is adopted from Walker et al. (2009a, and priv. comm.), of Leo II from Bellazzini et al. (2005), and of Sextans from Lee et al. (2003). We refer to these works for further details on the photometric observations and analysis. In all the studied dSphs the final photometric datasets are placed on a common V, I photometry scale in the Johnsons-Cousins photometric system (Carina: Walker et al. 2007; Fornax: Walker et al. 2006; Leo II: Bellazzini et al. 2005; Sextans: Lee et al. 2003; Sculptor: Walker et al. 2006; Coleman et al. 2005). We note that for Carina, Fornax, and Sculptor, there is WFI (Wide Field Imager camera at MPG/ESO 2.2 m telescope) photometry available for the spectroscopic targets (Carina: Koch et al. 2006; Fornax and Sculptor: Battaglia et al. 2006; 2008b, and priv. comm.), but we choose not to use these datasets since they are poorly calibrated.
3. Results
3.1. Color-magnitude diagrams
We show the color-magnitude diagrams (CMDs; small grey dots) of the five Galactic dSphs Sculptor, Sextans, Carina, Fornax, and Leo II in Fig. 1, along with Dartmouth isochrones (Dotter et al. 2007; 2008) overplotted with a fixed age of 12.5 Gyr and metallicities ranging from −2.5 dex to −1 dex with a step size of 0.5 dex. The thick black dots represent the stars in common between the photometric and spectroscopic samples, corresponding to 68 stars for Sculptor, 28 for Carina, 36 for Sextans, 132 for Fornax, and 27 for Leo II, here quoting the stars in common with the Ca T sample. We note that these numbers are further reduced after applying the spectroscopic metallicity cuts in addition to the photometric metallicity cuts, as explained later on in the analysis.
3.2. Photometric metallicities
For the five studied Galactic dSphs, we derive their photometric metallicities using linear interpolation between Dartmouth isochrones with a fixed age of 12.5 Gyr, with a range in metallicities from −2.5 dex to −0.3 dex and with a step size of 0.05 dex (e.g., Lianou et al. 2010). In practice, for each star under consideration, we interpolate between the two closest isochrones that bracket its color in order to find its metallicity. We use Dartmouth isochrones, since they give the best simultaneous fit to the full stellar distribution within a CMD as demonstrated by, e.g., Glatt et al. (2008a,b). We correct the magnitudes and colors of the theoretical isochrones for foreground Galactic extinction in the V-band and I-band and for the distance moduli, listed in Cols. (2)–(4) of Table 1, respectively. We analyse all bona-fide RGB stars that lie within 3 mag below the I-band magnitude of the TRGB, listed in Table 1, regardless of whether they were observed spectroscopically, in order to derive the mean photometric metallicity properties and compare them with the mean spectroscopic properties. We impose a metallicity cut on the derived photometric metallicities so as to only include stars that fall within the theoretical isochrones’ metallicity range of −2.5 dex to −0.3 dex used in the interpolation method, thus excluding any extrapolated values. Additionally, we require the photometric metallicity uncertainties to be less than 0.2 dex, which is the upper limit of accuracy typically achieved in low-resolution spectroscopic studies. The random uncertainties of the photometric metallicities are estimated by accounting for the photometric errors. For that purpose, each star is varied by its photometric uncertainties (both in color and magnitude) and re-fit using the same isochrone interpolation code. The 1σ scatter of the output random realisations is then adopted as the metallicity error for each star.
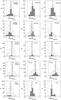 |
Fig. 2 Left panels: the white histograms show the photometric MDFs of all the stars within 3 mag below the TRGB, for Sculptor, Sextans, Carina, Fornax, and Leo II, while the shaded histograms show the same but only for the common stars. Middle panels: the white histograms show the Ca T-based MDFs on the CG97 metallicity scale for the full available spectroscopic sample, as described on the text, while the shaded histograms show the same but only for the stars in common. Right panels: the white histograms show the Ca T-based MDFs on the isoscale (discussed in Sect. 3.3), while the shaded histograms show the same but only for the common stars. In all panels, the vertical black dashed line corresponds to the median metallicity of the full sample, while the grey dashed line corresponds to the one of the common stars. The vertical dotted-dashed line in all panels corresponds to the isoschrone’s metal-poor limit of roughly −2.5 dex. Note that for Sextans on the isoscale MDF (right panel), the total number of the common stars is three (shaded histogram), while the one for the full sample is twelve (white histogram). |
We show the derived photometric metallicity distribution functions (MDFs) with the white histograms in Fig. 2 for Sculptor, Sextans, Carina, Fornax, and Leo II.
3.3. Dartmouth isochrones metallicity scale
In order to perform a direct comparison between the photometric and the spectroscopic metallicities, it is important to clarify to which metallicity scale the photometric metallicities conform. The photometric metallicities are tied to the isochrone models that are used in the interpolation method. The Dartmouth isochrones used here are not explicitly tied to any of the spectroscopic, standard abundance scales (i.e., ZW84; CG97; KI03; CBG09). Their metallicities are rather based on the mass fractions of the heavy elements and hydrogen in the models along with the adopted solar abundances. In that sense, the photometric metallicities based on the Dartmouth isochrones form a metallicity scale on their own. However, the Dartmouth models tend to lie close to the ZW84 and to the KI03 metallicity scales (Dotter, priv. comm., see also Dotter et al. 2010).
Galactic GC metallicities in different metallicity scales.
In Table 2 we show as an example the mean metallicities of three Galactic GCs with metallicities on the ZW84 (adopted from R97; their Table 2, Col. 5), CG97 (adopted from R97; their Table 2, Col. 6), KI03, CBG09, and Koch & McWilliam (2008, 2011, hereafter KM08, 11) metallicity scales, as well as the metallicity derived through isochrone fitting using Dartmouth isochrones (Dotter et al. 2010). Indeed, the metallicities derived using isochrone fitting agree better with the metallicities on the ZW84, KI03 and CBG09 scales and the differential reference scale based on high-resolution spectroscopy of KM08, 11 than with the CG97 metallicty scale. Furthermore, in Fig. 3, upper panel, we plot the Galactic GC fiducials of M 15, NGC 6397, M 2, and Tuc 47, adopted from DA90, along with Dartmouth isochrones for a fixed age of 12.5 Gyr. The metallicities of the Galactic GC fiducials are −2.17, −1.91, −1.58, and −0.71 dex, respectively, on the ZW84 scale (adopted from DA90), and the same metallicities are chosen for the Dartmouth isochrones. In the middle and lower panels we plot the analytic fits to the fiducial loci of GC RGBs adopted from Saviane et al. (2000a), on the ZW84 and CG97 metallicity scales, respectively. In this comparison, the Dartmouth isochrones provide an excellent approximation to the DA90 fiducials on the ZW84 scale at the metal-poor and metal-rich end of the fiducials with slightly worse agreement at metallicities in between. The Dartmouth isochrones reproduce the GC RGB slopes very well. With the exception of the metal-poor end, the analytic fits to GC RGBs by Saviane et al. (2000a) on the ZW84 metallicity scale show offsets compared to the Dartmouth isochrones (Fig. 3, middle panel). When comparing the Dartmouth isochrones to Saviane’s et al. analytic fits on the CG97 scale, the slopes are quite similar, but the fiducials of Saviane et al. are systematically too metal-poor. At the metal-rich end (~−0.7 dex), the isochrones and the fiducials show substantial discrepancies.
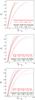 |
Fig. 3 Upper panel: galactic GC fiducials from DA90 shown as black dashed lines, along with Dartmouth isochrones shown as red solid lines. From left to right, the Galactic GC fiducials correspond to M 15, NGC 6397, M 2 and 47 Tuc, where the GCs have a metallicity of −2.17, −1.91, −1.58 and −0.71 dex, respectively, on the ZW84 scale. The isochrones correspond to an age of 12.5 Gyr and have the same metallicities as the Galactic GCs, from left to right. Middle panel: analytic functions of Galactic GC fiducial loci from Saviane et al. (2000a) on the ZW84 scale (black dashed lines) along with Dartmouth isochrones of 12.5 Gyr (red solid lines). The metallicities correspond to −1.99, −1.37, −1.23, −1.15, and − 0.7 dex from left to right, respectively. Lower panel: the same as in the middle panel but for the CG97 metallicity scale. The metallicities correspond to −2.11, −1.67, −1.53, −1.33, and −0.71 dex from left to right, respectively. |
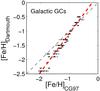 |
Fig. 4 Transformation from the CG97 metallicity scale to the Dartmouth isochrone metallicity scale, simply called “isoscale”. The red thick dashed line corresponds to the error-weighted linear least squares fit to the data. The black thin dashed line corresponds to unity. |
Therefore, considering that the Dartmouth isochrones form a metallicity scale of their own, we transform the CG97 spectroscopic metallicities of all five dSphs to the metallicity scale defined by the Dartmouth isochrones. We call the metallicity scale defined by the Dartmouth isochrones simply “isoscale”. In order to derive this transformation, we use the metallicities of those Galactic GCs in Dotter et al. (2010, their Table 2), derived using isochrone fitting that also have metallicities on the CG97 metallicity scale as derived in R97 (their Table 2). In total we include 50 Galactic GCs. The resulting transformation of the metallicities from the CG97 to the isoscale reads as follows: ![Mathematical equation: \begin{equation} [{\rm Fe/H}]_{\rm isoscale} = 1.35_{(\pm0.04)} [{\rm Fe/H}]_{\rm CG97} + 0.27_{(\pm0.06)}, \end{equation}](/articles/aa/full_html/2011/07/aa16998-11/aa16998-11-eq58.png) (1)and holds within the metallicity range of −2.02 ≤ [Fe/H]CG97 ≤ − 0.5 (dex), as given by the availability of GCs with [Fe/H] on the CG97 metallicity scale that also have [Fe/H] based on the Dartmouth isochrone fitting. The transformation is plotted in Fig. 4. The reversed metallicity transformation from the isoscale to the CG97 metallicity scale reads as follows:
(1)and holds within the metallicity range of −2.02 ≤ [Fe/H]CG97 ≤ − 0.5 (dex), as given by the availability of GCs with [Fe/H] on the CG97 metallicity scale that also have [Fe/H] based on the Dartmouth isochrone fitting. The transformation is plotted in Fig. 4. The reversed metallicity transformation from the isoscale to the CG97 metallicity scale reads as follows:
![Mathematical equation: \begin{equation} [{\rm Fe/H}]_{\rm CG97} = 0.70_{(\pm0.02)} [{\rm Fe/H}]_{\rm isoscale} - 0.26_{(\pm0.04)}, \end{equation}](/articles/aa/full_html/2011/07/aa16998-11/aa16998-11-eq61.png) (2)and holds within the metallicity range of −2.4 ≤ [Fe/H]isoscale ≤ −0.5 (dex), which is defined by the available metallicities of the GCs based on the isochrone fitting.
(2)and holds within the metallicity range of −2.4 ≤ [Fe/H]isoscale ≤ −0.5 (dex), which is defined by the available metallicities of the GCs based on the isochrone fitting.
Since we do not have enough Galactic GCs that have metallicities in both the MRS metallicity scale and the Dotter et al. (2010) sample, we perform the comparison between the photometric metallicities and the MRS metallicities without transforming the latter ones to the scale of the former. Therefore, in the later sections, the comparison of the MRS and photometric metallicities will not be performed on the isoscale.
3.4. Spectroscopic metallicities
The white histograms in the middle and right panels of Fig. 2 show the Ca T-based spectroscopic MDFs on the CG97 metallicity scale and on the isoscale, for Sculptor, Sextans, Carina, Fornax, and Leo II. These histograms were derived using the whole available spectroscopic sample with the requirement that the spectroscopic metallicities (of all dSphs apart from Sextans) are within the range of −2 ≤ [Fe/H]CG97 ≤ −0.2 (dex) for the CG97 metallicity scale (Cole et al. 2004), and −2.02 ≤ [Fe/H]isoscale ≤ −0.5 (dex) for the isoscale. Within this metallicity range the linear calibration between [Fe/H] and W′ (or ΣW) is valid (Cole et al. 2004).
For Sextans on the CG97 metallicity scale, we adopt the metallicity range of −4 ≤ [Fe/H]CG97 ≤ −0.5 (dex) (Battaglia et al. 2011), where the revised calibration of the Ca T of Starkenburg et al. (2010) has been applied to derive [Fe/H] based on the sum of the Ca T lines, ΣW, on the CG97 metallicity scale.
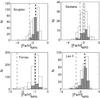 |
Fig. 5 The white histograms show the MRS MDFs for the full available MRS sample for Sculptor, Sextans, Fornax, and Carina. The shaded histograms show the MRS MDFs for the stars in common to both the MRS and photometric samples. In all panels, the vertical black dashed line corresponds to the median metallicity value of the full sample, while the grey dashed line corresponds to the median metallicity value of the common stars. The vertical dotted-dashed line corresponds to the lower limit of the most metal-poor isochrone used of roughly −2.5 dex. |
In Fig. 5 we show the MRS-based MDFs of the whole available spectroscopic sample (white histograms) for Sculptor, Sextans, Fornax, and Leo II.
3.5. Photometric and spectroscopic metallicities of the common stars
The photometric and spectroscopic MDFs for those stars with both photometric and Ca T-based spectroscopic measurements are shown as the shaded histograms in Fig. 2 for Sculptor, Sextans, Carina, Fornax, and Leo II. In order to construct the photometric MDFs of the common stars, only those stars within the photometric metallicity range of −2.5 < [Fe/H]phot ≤ −0.3 dex and with an error of less than 0.2 dex are retained. The distribution of the common stars falls within 3rc, 1.5rc, 2rc, 5rc, 1.5rc for Sculptor, Sextans, Carina, Fornax, and Leo II, respectively, where rc denotes the core radius of each dSph adopted from Irwin & Hatzidimitriou (1995). For the spectroscopic MDFs of the common stars in addition to the photometric metallicity cuts we impose the Ca T spectroscopic metallicity cuts as described in Sect. 3.4. The number of the common stars that have metallicities both on the CG97 metallicity scale and on the isoscale are listed in Table 5, except for Sextans. As shown in Fig. 2, Sextans only has three stars for which we have both reliable photometry and Ca T spectroscopy. Thus we exclude Sextans from any further analysis regarding common stars.
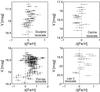 |
Fig. 6 V-band magnitude versus the difference in spectroscopic minus the photometric metallicities on the isoscale for Sculptor, Carina, Fornax, and Leo II. |
The differences of the Ca T spectroscopic (on the isoscale) minus the photometric metallicities versus the V-band magnitudes are shown in Fig. 6 for Sculptor, Carina, Fornax, and Leo II. There is a slight trend of the metallicity differences to become negative as the V-band magnitude becomes fainter, and to become positive as the V-band magnitude becomes brighter. This trend is not significant, as indicated by the Pearson correlation coefficients of −0.44, −0.31, −0.2, −0.15 for Sculptor, Carina, Fornax, and Leo II, respectively. We note that the spacing between the isochrones decreases towards the metal-poor end so that an unambiguous assignment of metallicities becomes difficult. This results in an inability of the photometric metallicities to reproduce the Ca T spectroscopic metal-poor tail of the MDF (cf. Koch et al. 2008b). On the other hand, the Ca T method has its largest sensitivity at the metal-poor end.
The shaded histograms in Fig. 5 show the MRS-based MDFs of the common stars. Again, only stars with photometric metallicities within the range of −2.5 dex to − 0.3 dex are included. The number of the common stars for each dSph is listed in Table 5.
4. Discussion
In a stellar system with a complex SFH where both old and intermediate-age stellar populations are present, its RGB contains stars belonging to the full age range of approximately 1.5 Gyr and older ages (Salaris et al. 2002), depending on the details of the stellar system’s SFH. Thus the assumption of a single old age for the stellar populations and therefore for the isochrones used in the interpolation holds only in the case of a negligible intermediate-age population. In dSphs, the initial star formation may have lasted as long as 3 Gyr or even longer (Marcolini et al. 2008; Ikuta & Arimoto 2002), thus leading to large metallicity dispersions (Grebel et al. 2003). In the case of dSphs dominated by old populations with ages larger than 10 Gyr, this extended star formation does not substantially affect their photometric metallicities and can lead to photometric metallicity differences of individual stars of only approximately 0.1 dex, as demonstrated in Lianou et al. (2010) using isochrone grids of two different ages (12.5 Gyr and 10.5 Gyr) and a range in metallicities in M 81 group dSphs. Here we explore the effects of the presence of intermediate-age populations on deriving photometric metallicities under the assumption of a single old age. For that purpose, we compare the photometric metallicities with spectroscopic metallicities derived through the Ca T method and through the MRS method, on a star-by-star basis.
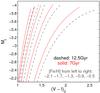 |
Fig. 7 Dartmouth isochrones for an age of 12.5 Gyr (black dashed) and 7 Gyr (red solid). The intermediate-age isochrone lies bluewards from the older isochrone at a fixed metallicity. Note that for a constant age and different values of [Fe/H] the slope of the RGB changes, while for a varying age and a constant [Fe/H] the slope of the RGB changes very little. |
It is clear that in the presence of intermediate-age populations we do not expect a priori that there will be an agreement between the photometric and spectroscopic metallicities. The existence of mixed-age populations is expected to lead to an overestimate of the photometric metallicities towards the metal-poor part. At fixed metallicities, an intermediate-age population would lie bluewards in color on the RGB as compared to an old population. Thus, intermediate-age populations would be assigned more metal-poor metallicities than their true value, if they were erroneously assumed to be old. This photometric “metal-poor bias” is demonstrated in Fig. 7, where isochrones of two fixed ages of 12.5 Gyr and 7 Gyr are overplotted with metallicities ranging from −2.1 to −0.5 dex.
4.1. Mean metallicity properties
We list the mean photometric and mean spectroscopic metallicity properties for the five studied dSphs in Table 3, where both the mean and median metallicity values are listed, as well as the standard deviation. For the Ca T spectroscopic metallicities we list the mean metallicity properties both on the CG97 metallicity scale and on the isoscale. The mean properties were derived from the full available data sets, corresponding to the white histograms shown in Figs. 2 and 5. Therefore they do not correspond to the common stars.
4.1.1. Sculptor and Sextans
In the case of Sculptor and Sextans, the difference between their median photometric and median Ca T spectroscopic metallicities on the isoscale is 0.08 dex. The typical photometric metallicity uncertainties have a median of 0.13 dex and 0.06 dex for Sculptor and Sextans, respectively, while the typical spectroscopic uncertainties have a median of 0.11 dex and 0.15 dex for Sculptor and Sextans, respectively. Sculptor and Sextans are dominated by old populations. The fraction of the old populations is more than 86% in Sculptor and 100% in Sextans (Orban et al. 2008). It is therefore reassuring that the photometric and Ca T spectroscopic metallicities on the isoscale are in such a good agreement.
There is good agreement also between the median photometric metallicity of Sculptor and its median Ca T spectroscopic metallicity on the CG97 metallicity scale, with a difference of 0.2 dex, while typical spectroscopic metallicity uncertainties on the CG97 metallicity scale have a median of 0.05 dex. This is not the case for Sextans, where the difference of the median spectroscopic and the photometric metallicity amounts to 0.48 dex, based on 173 stars (Battaglia et al. 2011) (white histogram in the middle panel of Fig. 2). This mismatch between the two median metallicity values for Sextans can be explained if one considers that the individual Ca T spectroscopic metallicities on the CG97 metallicity scale include metallicity values as metal-poor as − 4 dex (Battaglia et al. 2011), while the individual photometric metallicities were restricted to −2.5 dex, which is the most metal-poor value of metallicity provided for the Dartmouth isochrones. Therefore, the different selection criteria in terms of metallicity ranges used for the metallicities on the CG97 metallicity scale and the photometric metallicities may account for this large difference, which further suggests that such a comparison may not be appropriate for a galaxy with as metal-poor stars as in Sextans.
Finally, the agreement between the medians of the photometric and MRS metallicities is quite good in the case of Sculptor where their difference amounts to only 0.03 dex, whereas for Sextans their difference amounts to 0.19 dex. Typical MRS metallicity uncertainties have a median of 0.12 dex and 0.19 dex for Sculptor and Sextans, respectively.
4.1.2. Carina, Fornax, and Leo II
Carina, Fornax, and Leo II have complex star formation and chemical enrichment histories that produced substantial intermediate-age populations, each in different amounts. The difference of their median photometric metallicity from their median spectroscopic metallicity is indeed non-zero, with the tendency of the median photometric metallicities to be more metal-poor than the spectroscopic ones.
Mean metallicity properties corresponding to the mixture of stellar fractions as described in Sect. 4.1.2.
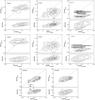 |
Fig. 8 The first two rows show, from left to right, the photometric versus the Ca T spectroscopic metallicities (upper panels), as well as the residuals of the comparison (lower panels), on the CG97 metallicity scale and on the isoscale for Carina, Fornax, and Leo II. The last row shows the same for Sculptor. The error-weighted contours range from 0.5 to 2.5σ in steps of 0.5. The upper panel dashed line indicates unity. |
We can qualitatively estimate the expected metal-poor bias by comparing the median metallicity derived assuming a purely old population with the median metallicity derived assuming a mixture of the stellar populations. In order to find the median metallicity of a mixture of stellar populations, we use the fraction of the total stellar mass formed within the last 10 Gyr and 1 Gyr (f10 G, f1 G, respectively; Orban et al. 2008, their Table 1; reproduced in Table 5) in conjuction with the mean mass-weighted age (τ; Orban et al. 2008, their Table 1; reproduced in Table 5) for Carina, Fornax, and Leo II. For that purpose, we run the interpolation code with a constant age of the isochrones equal to τ. Then, we randomly assign finter = (f10 G − f1 G)% of the stars within our RGB sample metallicities as derived using isochrones with constant ages equal to τ. The remaining 100 − finter of the stars are assigned their original metallicities, assuming that they are of a constant, old age of 12.5 Gyr. In all cases, the range in metallicities is varied from −2.5 dex to −0.3 dex. The median metallicity of the mixture of stellar populations is −1.34 dex for Carina, −1.35 dex for Fornax, and −1.56 for Leo II. These values are listed in Table 4, along with the mean metallicities and the standard deviations. The difference of the median metallicities when assuming a purely old stellar population and when assuming a mixture of stellar populations results in 0.17 dex, 0.16 dex, and 0.15 dex, respectively, for the aforementioned dSphs making them more metal-rich in the case of mixed-age populations. The differences of the median photometric from the median spectroscopic (on the isoscale) metallicities in the case of Carina and Leo II are consistent with such mixtures of the stellar populations, while in the case of Fornax the difference is larger than that computed using its respective admixture. This suggests that either a higher fraction finter and/or a younger age τ is required in order to produce such a difference. The age τ of Fornax is 7.4 Gyr (Orban et al. 2008). If we assume 100% of the stars within our RGB sample to have formed with this age we derive a median photometric metallicity of −1.29 dex. Subtracting the latter value from the median photometric metallicity assuming a purely old population does not lead to the same difference as that between the photometric and spectroscopic (on the isoscale) medians. Therefore, an age τ much younger than 7.4 Gyr is required in order to justify the difference between the median photometric and spectroscopic (on the isoscale) metallicities. It turns out that all the stars in our RGB sample would need to have an age of ~4 Gyr in order to force agreement between the photometric and spectroscopic metallicities. Moreover, we compute that (84, 72, 55)% of the stars within our RGB sample would have an age of approximately (3.5, 3, 2) Gyr, respectively. Therefore, stars within our RGB sample with a fraction finter from 55% to 100% and with ages from 2 Gyr to 4 Gyr, respectively, are required in order to produce the observed difference between the median photometric metallicity and the median spectroscopic metallicity on the isoscale for Fornax. These age ranges are consistent with the findings of Coleman & de Jong (2008), i.e., that Fornax experienced a strong burst of star formation during the last 3–4 Gyr. We also note that Fornax has the largest age spread ever found in any Galactic dSph, extending to ages as young as 100–200 Myr (Grebel & Stetson 1999).
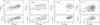 |
Fig. 9 Photometric metallicities versus MRS metallicities (upper panels), as well as their residuals (lower panels), in the sense of MRS metallicities minus photometric metallicities versus MRS metallicities, for Sculptor, Sextans, Fornax and Leo II. The error-weighted contours range from 0.5 to 2.5σ in steps of 0.5. The upper panel dashed line indicates unity. |
4.2. General error sources for photometric metallicities
For those stars with both spectroscopic and photometric measurements, we show the photometric versus the Ca T metallicities in the upper panels of Fig. 8, separately on the CG97 metallicity scale and on the isoscale for Carina, Fornax, Leo II, and Sculptor. For those stars with both MRS and photometric measurements, the photometric versus the MRS metallicities is shown in Fig. 9 for Sculptor, Sextans, Fornax, and Leo II. In all cases, the lower panels each show the residuals of the comparison. Δ [Fe/H] is always the difference between the spectroscopic metallicities minus the photometric metallicities.
A positive difference Δ[Fe/H] means that the spectroscopic metallicities are more metal-rich than the photometric metallicities. The photometric systematic uncertainty that can contribute to a positive difference Δ[Fe/H] is the photometric metal-poor bias due to the presence of an intermediate-age population. This metal-poor bias has been estimated to amount to up to 0.4 dex for a star-by-star comparison when deriving photometric metallicities assuming a single old age of 12.5 Gyr for the underlying population as compared to assuming a single age of 8.5 Gyr (Lianou et al. 2010), with the maximum difference occurring at the metal-poor end.
Possible sources of uncertainties that can contribute to the photometric metallicities are the distance modulus and reddening. In the case of Sculptor, a variation of the distance modulus by ± 0.14 mag, which corresponds to a relative error of less than 1%, leads to a relative difference of photometric metallicities of 10%, where an increase of the distance modulus by 0.14 mag leads to more metal-poor metallicities. A variation of the reddening by ± 0.02 mag, which corresponds to a relative error of less than 16%, leads to a relative difference of the photometric metallicities of 12%, where an increase in the reddening by 0.02 mag leads again to more metal-poor metallicities.
Another source of uncertainty originates from the assumption of a scaled-solar composition of the [α/Fe] chosen for the Dartmouth isochrones. Again, using Sculptor as a test case, we choose an [α/Fe] equal to + 0.2 dex, constant through the whole range of the photometric metallicities. This choice leads to more metal-poor individual photometric metallicities, approximately by 6% for the relative differences, while the median photometric metallicity gets more metal-poor by 0.1 dex (see also Kalirai et al. 2006). Individual α-element ratios for Sculptor indicate that [α/Fe] has an average value of approximately zero (Venn et al. 2004; their Figs. 2 and 7), across the range of metallicities we consider here for the isoscale of − 2.02 ≤ [Fe/H]CG97 ≤ − 0.5 (dex). For the dSphs that have more complex SFHs, the choice of an [α/Fe] of zero is further justified by the range of ages of the stars present, where their [α/Fe] tends to approach solar values, as discussed in Koch et al. (2008b). Furthermore, for Carina and for the metallicity ranges we consider here, the [α/Fe] ratio has an average value of approximately zero (Koch et al. 2008a, their Fig. 2, left bottom panel), and the same holds for Fornax (Letarte et al. 2010; Venn et al. 2004, their Fig. 2).
The motivation of keeping the α-element enhancement constant through the whole metallicity range, in contrast to what high-resolution α-element abundances indicate (e.g., Koch et al. 2008a; Cohen & Huang 2009; 2010, and references therein), stems from the fact that the exact position of the “knee”, formed by a plateau of constant [α/Fe] as a function of [Fe/H] and by the declining values of [α/Fe] towards the metal-rich end due to the SN Ia contribution, depends on the star formation and chemical evolution history of each dSph (e.g., Marcolini et al. 2008). In more distant galaxies it is not possible to obtain high-resolution measurements or to measure individual stellar [α/Fe] ratios. Therefore one cannot infer the location of the knee, whose position could be used to fit [α/Fe] as a function of the [Fe/H] range (Cohen & Huang 2009; 2010) and then use such a function as an input for the [α/Fe] in the isochrones. Thus, one needs to choose a constant [α/Fe] value for the whole metallicity range used in the isochrones. We note that the present day high-resolution spectroscopic measurements of metallicities of the dSphs studied here permit the determination of the location of the knee in conjuction with detailed chemical evolution models in the cases of Sculptor and Carina (Geisler et al. 2007; Koch et al. 2008a; Lanfranchi et al. 2006), while in the remaining dSphs only limits on the position of the knee can be placed (e.g., Koch 2009; Tolstoy et al. 2009; Lanfranchi & Matteucci 2010, and references therein).
4.3. Sculptor
4.3.1. Ca T versus photometric metallicities
In the case of an old-age dominated population such as in Sculptor, one would expect the photometric metallicities to match the spectroscopic metallicities once everything has been placed on the same metallicity scale. This is not what is observed in Fig. 8 for Sculptor, where there is an excess of stars with positive Δ[Fe/H] that increases towards the Ca T spectroscopic metal-rich end. On the isoscale, the median value of the difference Δ[Fe/H] is equal to 0.08 dex with a full range of 0.82 dex, while typical metallicity uncertainties have a median of 0.05 dex (photometric) and 0.11 dex (Ca T). The minimum Δ[Fe/H] is equal to −0.24 dex and the maximum is equal to 0.58 dex. The slope of the difference in metallicities Δ[Fe/H] versus the spectroscopic metallicity is listed in Table 5. On the CG97 metallicity scale, the median value of Δ[Fe/H] is equal to 0.28 dex with a full range of 1.01 dex.
There is a very good agreement between the metallicities of the two methods within the metallicity range from −2 dex to −1.5 dex, as shown in Fig. 8. The median difference of the spectroscopic metallicity minus the photometric metallicity in this metallicity range is 0.01 dex, while the full range of the difference in metallicities remains the same, equal to 0.82 dex.
4.3.2. High-resolution versus photometric metallicities
The spectroscopic metallicities in our samples may be as metal-poor as −4 dex. Tafelmeyer et al. (2010) find two extremely metal-poor stars in Sculptor that are shown by red and blue asterisks in the CMD of Sculptor (Fig. 1; red: Scl 07–50; blue: Scl 07–49). These extremely metal-poor stars have a high-resolution Fe I abundance of −3.96 dex and −3.48 dex, respectively, while they are assigned a photometric metallicity of −2.55 dex and −2.71 dex in our study, respectively. These photometric metallicities are rejected since they are extrapolated values outside the color and metallicity range used for the isochrone interpolation. Although it may be useful to have Dartmouth isochrones with more metal-poor values than − 2.5 dex, the spacing of the isochrones in the metal-poor part gets increasingly narrow, so even small photometric uncertainties lead to very large metallicity uncertainties.
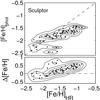 |
Fig. 10 Photometric metallicity, as well as the residuals, as a function of the high-resolution spectroscopic metallicity. The error-weighted contours range from 0.5 to 2.5σ in steps of 0.5. The upper panel dashed line indicates unity. |
In Fig. 10, we show the high-resolution spectroscopic metallicities from Battaglia et al. (2008b) versus the photometric metallicities, as well as their residuals. Given that Sculptor is an old-age dominated system, we do not expect to have any significant age effects affecting the metallicities. We note that in Fig. 10 (upper panel), there exist some stars towards the photometric metal-poor end that have more metal-rich high-resolution metallicities, which could be indicative of a metal-poor bias or may be due to the decreased metallicity sensitivity of the photometric method for bluer RGB colors. Again, there is the tendency of Δ[Fe/H] to increase towards the high-resolution spectroscopic metal-rich end. The median of the differences is 0.23 dex, while the relative differences Δ[Fe/H]/[Fe/H]HR in this case are approximately 16%. Typical high-resolution metallicity uncertainties have a median of 0.1 dex. The full range of the differences is equal to 1.17 dex, with minimum diffefence of − 0.36 dex and maximum difference of 0.81 dex.
4.3.3. MRS versus photometric metallicities
The same trend of an excess of stars with positive Δ[Fe/H] is observed in Fig. 9, where we compare the MRS metallicities with the photometric metallicities. In addition, in some cases there is also an excess of stars with negative Δ[Fe/H], indicative of stars with spectroscopic metallicities more metal-poor than the photometric ones. In any case, the discrepancy between the MRS metallicities and the photometric metallicities is higher than in the case of the Ca T-based spectroscopic metallicities. The median of the differences between the photometric and MRS metallicities is 0.1 dex, while the full range of the differences is 1.62 dex, which is double the full range in the case of the Ca T on the isoscale versus photometric metallicities. Typical MRS metallicity uncertainties have a median of 0.11 dex. The minimum Δ[Fe/H] is equal to − 0.94 dex and the maximum is equal to 0.68 dex. The slope of the difference in metallicities Δ[Fe/H] versus the MRS metallicity is listed in Table 5.
4.3.4. Ca T versus MRS metallicities
The Ca T and MRS metallicities of a given star differ from each other (Fig. 11), and from high-resolution measurements (Battaglia et al. 2008b, for Ca T; Kirby et al. 2009, for MRS). Shetrone et al. (2009) discuss that the discrepancy between the Ca T-based and MRS metallicities for Leo II may be due to the different metallicity scales, among other factors. It would be thus interesting to compare the Ca T and MRS metallicities when both are placed to a common metallicity scale, such as the isoscale. Such a comparison needs to be postponed until more Galactic GC metallicities on the MRS scale are observed that are in common with the Dotter et al. (2010) GC sample.
In the case of Sculptor, the Ca T versus the MRS metallicities are shown in the upper left panel of Fig. 11. The median of the differences between the Ca T and MRS metallicities is 0.09 dex, while the full range of the differences is 1.69 dex. We note that the latter full range of the difference in metallicities is twice the full range as compared to the Ca T versus photometric metallicities, for Sculptor, but of the same order as compared to the MRS versus the photometric metallicities case. Typical metallicity uncertainties have a median of 0.06 dex (Ca T) and 0.11 dex (MRS). The minimum Δ[Fe/H] is equal to −1.38 dex and the maximum is equal to 0.31 dex. If we focus on the Ca T metallicity range from −2 dex to −1.5 dex, then the median of the metallicity differences is equal to 0.2 dex, with a full range of the differences of 0.69 dex, while the minimum value of the difference is − 0.54 dex and the maximum value of the difference is 0.15 dex. In this metallicity range, the median of the metallicity differences is double the one in the case of the Ca T on the isoscale versus the photometric metallicities. In the metallicity range where the Ca T is the most sensitive, there seems to be similarly highly discrepant to the MRS metallicities.
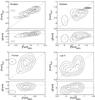 |
Fig. 11 From left to right, the upper panels show the Ca T spectroscopic metallicities versus the MRS metallicities for Sculptor, Sextans, Fornax, and Leo II, while the lower panels show their residuals. The error-weighted contours range from 0.5 to 2.5σ in steps of 0.5. The upper panel dashed line indicates unity. |
4.3.5. Age effects in Sculptor
Sculptor is an old-age dominated system, with more than 86% of its stars having ages larger than 10 Gyr (Orban et al. 2008). The presence of old, low-luminosity AGB stars may contribute to the Δ[Fe/H] becoming positive due to the photometric metal-poor bias, but the overall mean metallicity properties are unaffected (e.g. Lianou et al. 2010). Hurley-Keller et al. (1999) discuss that Sculptor may contain two old stellar populations, based on its horizontal branch morphology, while Harbeck et al. (2001) find a population gradient and Tolstoy et al. (2004) identify two kinematically distinct ancient components. De Boer et al. (2011) suggest that star formation in Sculptor ceased 7 Gyr ago. Furthermore, Menzies et al. (2011) identify two AGB variables, one of which suggests that stars as recent as 1–2 Gyr ago may have formed, consistent with the age distribution modelling that Revaz et al. (2009) derive.
Motivated by the recent findings of de Boer et al. (2011), we use an isochrone of 7 Gyr to derive the photometric metallicities of Sculptor. The new median metallicity becomes more metal-rich by 0.28 dex, which would place a metal-rich limit on the median metallicity of Sculptor assuming that 100% of the stars have an age of 7 Gyr. We further use the fractions of the total stellar mass of Sculptor given in Orban et al. (2008) to derive the intermediate-age stellar fraction, which is equal to f10 G − f1 G. Then, we randomly assign a corresponding fraction of the stars in our RGB sample to this intermediate-age population with metallicities derived using the 7 Gyr isoschrones, while the remaining fraction of stars is assigned metallicities based on the 12.5 Gyr isochrones. The derived median metallicity of this mixture becomes more-metal rich by 0.02 dex. If we ask instead what the fraction of the intermediate-age stars (with an age of 7 Gyr) is that would produce a metallicity difference of the order of that between the Ca T (placed on the isoscale) and photometric median metallicities of 0.08 dex, we find a fraction of 24%. That is, 24% intermediate-age stars with ages of 7 Gyr are needed in order to result in a difference of the median photometric metallicity of the mixed-age population and the median photometric metallicity assuming a purely old system of 0.08 dex.
4.4. Sextans
Sextans is the only dSph in our sample that consists of purely old stellar populations (Orban et al. 2008; Lee et al. 2009). As described earlier, we do not perform a comparison of individual common stars between the Ca T and photometric metallicies since we do not have enough stars in common. Here, we only compare the MRS versus the photometric metallicities, as well as the Ca T-based versus the MRS metallicities.
4.4.1. MRS versus photometric metallicities
The second panel from the left in Fig. 9 shows the MRS metallicity versus the photometric metallicity, as well as the residuals. Since Sextans is a purely old system, one would again expect a very good agreement between the MRS and photometric metallicities. As shown in Fig. 9, this is not the case. The median of the differences between the photometric and MRS metallicities is 0.07 dex, while the full range of the differences is 1.48 dex. The relative differences are 11%. The slope of the difference in metallicities Δ[Fe/H] versus the MRS metallicity is listed in Table 5. Typical spectroscopic uncertainties have a median of 0.12 dex.
4.4.2. Ca T versus MRS metallicities
In the upper right panel of Fig. 11 we show the Ca T versus the MRS metallicities for Sextans. In this case, again a high scatter is observed between the two spectroscopic methods. The median of the differences between the Ca T and MRS metallicities is 0.12 dex, while the full range of the differences is 0.83 dex. Typical metallicity uncertainties have a median of 0.15 dex (Ca T) and 0.12 dex (MRS). The spectroscopic measurements are assumed to be independent of age.
4.5. Carina, Fornax and Leo II
Carina, Leo II and Fornax have a significant fraction of intermediate-age stars that lead to an age-metallicity degeneracy along the RGB, as shown in Fig. 10 of Koch et al. (2006) for Carina, in Fig. 8 of Koch et al. (2007) for Leo II, and in Fig. 22 of Battaglia et al. (2006) for Fornax. These complex SFHs will affect the photometric metallicities in the sense of the photometric metal-poor bias discussed earlier.
4.5.1. Ca T versus photometric metallicities
In all cases, just as with Sculptor, Fig. 8 shows a trend of increasingly positive Δ [Fe/H] with increasing [Fe/H]. The same trend is observed in the study of Gullieuszik et al. (2007, their Fig. 13) for Fornax, where they compare their photometric metallicities, derived from near-IR colors, with the Ca T spectroscopic measurements of Battaglia et al. (2006) and Pont et al. (2004). In our study, the positive differences of the metallicities are attributed to the presence of intermediate-age stars, which have bluer colors than old stars at a given metallicity, as demonstrated in Fig. 7. The negative differences can be attributed to the poorer resolution of the isochrones towards the metal-poor end. The median Δ[Fe/H] is 0.18 dex, 0.13 dex, and 0.52 dex for Carina, Leo II and Fornax, respectively, while the full range of Δ[Fe/H] is approximately 0.58 dex, 1.17 dex, and 2.37 dex respectively. The values quoted refer to the Ca T-based spectroscopic metallicities placed on the isoscale. Typical spectroscopic uncertainties have a median of 0.17 dex, 0.24 dex, and 0.16 dex, while typical photometric metallicity uncertainties have a median value of 0.05 dex, 0.02 dex, and 0.11 dex, for the above mentioned dSphs, respectively. If we focus on the metallicity range from −2 dex to −1.5 dex, then the agreement between the Ca T and photometric metallicities seems better, with a median Δ[Fe/H] of 0.21 dex, 0.1 dex, and 0.13 dex for Carina, Leo II and Fornax, respectively, while the range of Δ[Fe/H] is equal to 0.37 dex, 0.99 dex, and 1.41 dex, for the above mentioned dwarfs, respectively.
4.5.2. High-resolution versus photometric metallicities
In the case of Fornax, Tafelmeyer et al. (2010) find one extremely metal-poor star in common to our photometric sample, shown with the red asterisk in the CMD of Fornax (Fig. 1; Frx 05–42). This extremely metal-poor star has a high-resolution Fe I abundance of −3.66 dex, while it is assigned a photometric metallicity of −2.98 dex. This photometric metallicity is again rejected since it is an extrapolated value outside the color and metallicity range used for the isochrone interpolation. Nevertheless, photometrically this star is correctly identified as a very metal-poor candidate.
Within our photometric metallicities, we identify several stars that photometrically have the right color–magnitude position to potentially be very metal-poor stars but which are not retained within our analysis since their photometric metallicities are extrapolated values. The majority of these stars, when we compare them with all the available spectroscopic metallicities, show indications of an age-metallicity degeneracy, in the sense that their photometric metallicities appear to be too metal-poor as compared to the spectroscopic metallicities. Certainly, these photometric metallicities are extrapolated values and in some cases with large photometric errors, in order to be able to make any solid argument.
4.5.3. MRS versus photometric metallicities
The same trends are observed when we compare the MRS metallicities with the photometric metallicities as shown in Fig. 9. The photometric and MRS spectroscopic metallicities become similarly discrepant as in the case of the Ca T metallicities. The median of the differences between the photometric and MRS metallicities is 0.45 dex for Fornax and 0.33 dex for Leo II, while the full range of the differences is 2.56 dex for Fornax and 2.11 dex for Leo II. The relative differences are 47% for Fornax and 24% for Leo II. The slopes of the difference in metallicities Δ[Fe/H] versus the MRS metallicity for Fornax and Leo II are listed in Table 5. The typical MRS metallicity uncertainties have a median of 0.1 dex, and 0.11 dex for Fornax and Leo II, respectively.
4.5.4. Ca T versus MRS metallicities
The lower left and right panels of Fig. 11 show the Ca T versus the MRS metallicities for Fornax and Leo II. Both these figures show a similarly large scatter as in the case of Sculptor and Sextans. Shetrone et al. (2009) compare the Ca T-based and MRS metallicities for faint Leo II stars and also find them to be discrepant in a similar way as we find them here. In our study, the median of the differences between the Ca T and MRS metallicities is 0.24 dex and 0.02 dex, respectively for Fornax and Leo II, while the full range of the metallicity differences is 1.12 dex and 1 dex, respectively. Typical metallicity uncertainties have a median of 0.14 dex (Ca T) and 0.11 dex (MRS) for Fornax, while for Leo II these are 0.16 dex (Ca T) and 0.11 dex (MRS).
In the case of Leo II and when we compare Δ[Fe/H] in the Ca T metallicity range from − 2 dex to − 1.5 dex, the median Δ[Fe/H] is 0.07 dex while its range is 0.88 dex. Based on these values, the agreement between the Ca T and MRS metallicities for Leo II is slightly better than in the Ca T on the isoscale versus photometric metallicities case. For Fornax, there are not any stars in common for metallicities less than − 1.5 dex.
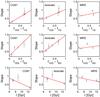 |
Fig. 12 Slopes of the error-weighted linear least squares fit to the datapoints of the lower panels of Figs. 8 and 9 as a function of the intermediate-age fractions ( f10 G − f1 G, upper panels; f10 G − f5 G; middle panels), as well as a function of the mass-weighted mean age τ (lower panels), for Sculptor, Sextans, Carina, Fornax and Leo II. The red solid line corresponds to an error-weighted linear least squares fit to the data. The error bars correspond to the error of the coefficients of the fit to the datapoints of Figs. 8 and 9. |
4.6. Δ[Fe/H] dependence on the dSph’s SFH
An error-weighted linear least squares fit to the datapoints of the lower panels of Figs. 8 and 9, which show Δ[Fe/H] as a function of the spectroscopic metallicities, results in the slopes listed in Table 5 for the CG97 metallicity scale, the isoscale, and the MRS metallicity scale. In the case of a purely old population, one would expect that the slope is zero, as a result of ideally zero differences between the photometric and spectroscopic metallicities. The non-zero slopes of the Δ[Fe/H] as a function of the spectroscopic [Fe/H] are shown in Fig. 12 which are now plotted against the f10 G − f1 G (upper panels), the f10 G − f5 G (middle panels), as well as against the mass-weighted mean age, τ, of each dSph (lower panels), adopted from Orban et al. (2008; f5 G is the fraction of stars formed within the last 5 Gyr). The values of f10 G, f5 G, f1 G, and τ are reproduced in Table 5.
In the upper panels of Fig. 12, there is a tendency of increasing the intermediate-age fraction to increase the slope of the Δ[Fe/H] as a function of the [Fe/H]spec. This is demonstrated by the red solid line which is an error-weighted linear least squares fit to the data points in Fig. 12. The error bars correspond to the errors of the coefficients of the fit to the datapoints of the lower panels of Figs. 8 and 9. The upper left panel of Fig. 12 suggests that the Ca T metallicities on the CG97 metallicity scale versus the photometric metallicities show the most pronounced dependence on increased intermediate-age fractions of stars whereas the discrepancies between MRS and photometric metallicities remain relatively low regardless of the admixture of younger populations. The Pearson correlation coefficients are 0.95, 0.85, and 0.54 for the CG97, isoscale, and MRS cases respectively, while it is significant only in the case of the CG97 metallicity scale within the 85% confidence level.
In the middle panels of Fig. 12, the same tendency is observed when we plot the slopes of Figs. 8 and 9 against the f10 G − f5 G fractions. Here, the trend is significant within the 98% confidence level only in the case of the isoscale, with a Pearson correlation coefficients of 0.96, but it is not significant in the remaining cases of the CG97 and MRS metallicity scales with a Pearson correlation coefficient of 0.87 and 0.24, respectively.
In the lower panels of Fig. 12, there is a much less significant trend of a decreasing mass-weighted mean age with an increasing slope of Δ[Fe/H] as a function of [Fe/H]spec. Again, the red solid line is an error-weighted linear least squares fit to the data points in Fig. 12, while the error bars correspond to the errors of the coefficients of the fit to the datapoints of the lower panels of Figs. 8 and 9. The lower panels of Fig. 12 suggest that the trend is insignificant within the 99% confidence level, with Pearson correlation coefficients of 0.81, 0.64, and 0.78 for the CG97, isoscale, and MRS cases respectively.
4.6.1. Applicability of the photometric metallicity method
The presence of an intermediate-age population in a dSph leads to a metal-poor bias in the photometric metallicities, in the sense that the stars are assigned with too metal-poor photometric metallicities compared to their spectroscopic values. In the case of the Galactic dSphs studied here, where some of them have a pronounced or even dominant intermediate-age population, the individual stellar differences of the spectroscopic minus the photometric metallicities can reach a range in metallicity spanning up to 2.37 dex in the case of Fornax which has the most extended star formation and chemical evolution history. In practice, the photometric metallicities become more metal-poor as compared to the Ca T spectroscopic or MRS metallicities when intermediate-age populations contribute. In dSphs where the fraction of the intermediate-age population is small, the assumption of a single old age when deriving photometric metallicities appears to yield relatively good results. In the case of Sculptor, there is a systematic trend of increasing Δ[Fe/H] with increasing Ca T [Fe/H] that mimics the same trend observed in dSphs with a substantial fraction of intermediate-age stars present, consistent with the recent findings of de Boer et al. (2011) and Menzies et al. (2011) regarding the range of ages of the stellar content of Sculptor. We find that 24% of intermediate-age stars with an age of 7 Gyr are needed in order to account for the difference of the median spectroscopic metallicity with the median photometric metallicity.
In more distant dSphs where the use of the Ca T method (or MRS) to derive spectroscopic metallicities is not available due to the faintness of the stars to be targeted, one has to rely on the photometric method in order to have an estimate of their metallicity. The mean metallicities derived from the photometric method in the case of dSphs dominated by old stars are biased towards the metal-poor end by approximately 0.08 dex as compared to the Ca T metallicities placed on the isoscale (for Sculptor). The intrinsic scatter in this case is 0.16 dex for the photometric metallicities and 0.20 dex for the spectroscopic metallicities placed on the isoscale, which leads to an intrinsic scatter of their difference of approximately 0.26 dex. The intrinsic scatter of the difference of the spectroscopic metallicity, on the isoscale, minus the photometric metallicity is 0.09 dex, 0.32 dex, and 0.24 dex for Carina, Fornax, and Leo II, respectively, which are less or comparable with the median of the Δ[Fe/H]. Thus, depending on the size of the fractions of intermediate-age stars, using the photometric method may underestimate the mean metallicity by a few tenths of dex in [Fe/H].
Given the fraction of the intermediate-age populations in a dSph, one can derive an estimate of how much offset the photometric metallicities may be as compared to the spectroscopic metallicities. In more distant dSphs, the ability of deriving accurate SFHs is hampered by the same age-metallicity degeneracy examined here (Gallart et al. 2005) on the RGB as well as by our inability to obtain CMDs that reach the old main-sequence turn-offs. Therefore, one has to rely on the presence of luminous AGB stars as a probe of the presence of intermediate age populations. In a study of MDFs of nine dSphs in the M 81 group of galaxies, we detected luminous AGB stars in all of them, with fractions ranging from 3% to 14% (Lianou et al. 2010; see also Caldwell et al. 1998; Da Costa 2004). Similarly, luminous AGB stars were detected in early-type dwarfs in other groups of galaxies (Rejkuba et al. 2006; Girardi et al. 2010; Crnojevic et al. 2011), as is also the case for Local Group dwarf galaxies (e.g., Battinelli & Demers 2004; Davidge 2005; Groenewegen 2007; Whitelock et al. 2009, and references therein).
5. Summary and conclusions
We test the validity of the photometrically derived stellar metallicities generally used under the assumption of a single old age, and we explore the effect of the presence of intermediate-age stellar populations on photometrically derived stellar metallicities. We choose five Galactic dSphs, namely Sculptor, Sextans, Carina, Fornax, and Leo II, which have different SFHs and contain a different fraction of intermediate-age stars, ranging from old ages in Sextans to very prominent intermediate-ages in Fornax. We use their resolved RGBs and we derive their photometric metallicities using a linear interpolation method assuming a constant old age for the theoretical isochrones and a wide range in metallicities, from −2.5 dex to −0.3 dex. We compare the photometric metallicities with Ca T-based spectroscopic metallicities, with MRS metallicities, and with high-resolution spectroscopic metallicities from the literature in several ways in order to examine the effect of the presence of intermediate-age stellar populations on the derivation of photometric metallicities. The comparison between the photometric and spectroscopic metallicities is performed both on the CG97 metallicity scale and on the metallicity scale defined by the Dartmouth isochrones in the case of the Ca T-based metallicities. Moreover, we simulate the effect of intermediate-age populations on the photometric metallicities via isochrone models of different ages.
The comparison of the mean photometric metallicity properties with the mean spectroscopic ones shows that we can safely trust the photometrically derived stellar metallicities in the case of old-dominated systems such as Sculptor and Sextans, where the comparison of the photometrically and spectroscopically derived median metallicity gives a difference of 0.08 dex. In systems such as Fornax, which has the most extended star formation and chemical enrichment history, the comparison between the mean metallicity properties derived from different methods gives highly discrepant results that amount to 0.51 dex in the case of the median MRS metallicity versus the median photometric metallicity. In order to account for a difference of 0.43 dex between the median photometric metallicity and the median spectroscopic metallicity on the isoscale, as observed in Fornax, it would require that a fraction of stars between 100% to 55% on the RGB formed from 4 to 2 Gyr ago, a finding that is also supported by Coleman & de Jong (2008).
For those stars that are in common in the spectroscopic and photometric samples and for galaxies that formed the majority of their stellar populations within the last 10 Gyr, we find the maximum difference between the median Ca T metallicity and the median photometric metallicity, amounting to 0.52 dex for Fornax, as well as the maximum range of the differences between the MRS and photometric metallicities (amounting to 2.56 dex again for Fornax). These differences become very small for almost purely old stellar populations, of the order of less than 0.1 dex for Sculptor and Sextans when comparing both MRS and Ca T metallicities with photometric metallicities.
There is the trend of the differences between the individual stellar metallicities derived from all methods to increase towards positive Δ[Fe/H], and this systematic deviation strongly depends on the particular SFH of each studied dSph. As compared to Ca T-based metallicities, the photometric metallicities seem to show the best agreement in the metallicty range from around −2 to −1.5 dex, independent of each particular SFH. It is interesting that the effect of age on the differences between MRS and photometric metallicities is less pronounced, regardless of the intermediate-age stellar mass fraction, while for Ca T metallicities versus photometric metallicities there is a stronger manifestation of the age-metallicity degeneracy.
Each spectroscopic method yields different results. Our comparison between metallicities from different spectroscopic methods shows differences of a similar size as the comparison of metallicities between spectroscopic methods and photometry in the case of the old-age dominated dSphs Sculptor and Sextans. Such differences are of the order of 0.1 dex. In the case of Leo II and Fornax, the comparison between different spectroscopic methods show differences smaller than those when comparing spectroscopic with photometric metallicities. As expected, we do find effects of the age-metallicity degeneracy for galaxies with high fractions of intermediate-age stellar populations. Therefore, we find that we are justified to use the photometric method of deriving stellar metallicities in the case of old or intermediate-age dominated dSphs when we focus on the metallicity range from − 2 dex to − 1.5 dex where Ca T metallicities and photometric metallicities agree the best independent of each dSph’s SFH. Furthermore, we are justified to use the photometric method in a wider metallicity range only when the dSph is old-age dominated, since then we get the least discrepant results between photometric and spectroscopic metallicities, although we note that the same discrepancy is observed between spectroscopic methods. Therefore, an estimate of the intermediate-age stars present in a dSph is important for stellar metallicities studies.
Acknowledgments
The authors thank an anonymous referee for the thoughtfull comments. We kindly thank Giuseppina Battaglia and Matthew Walker, the former for sharing with us the full photometric datasets of Sculptor and the Ca T spectroscopic dataset of Sextans, and the latter for sharing with us the full photometric datasets of Sculptor, Fornax, and Carina. We also kindly thank Aaron Dotter for extremely useful discussions on Dartmouth isochrones. Katrin Jordi and Thorsten Lisker are also acknowledged for useful discussions. SL acknowledges an IAU travel grant to participate to the XXVII GA, during which this work was motivated to initiate. S.L. and this research were supported within the framework of the Excellence Initiative by the German Research Foundation (DFG) via the Heidelberg Graduate School of Fundamental Physics (HGSFP) (grant number GSC 129/1). A.K. acknowledges support by an STFC postdoctoral fellowship and funding by the DFG through Emmy-Noether grant Ko 4161/1. This research has made use of the VizieR catalogue access tool, CDS, Strasbourg, France. This research has made use of the NASA/IPAC Extragalactic Database (NED) which is operated by the Jet Propulsion Laboratory, California Institute of Technology, under contract with the National Aeronautics and Space Administration. This research has made use of NASA’s Astrophysics Data System Bibliographic Services.
References
- Aaronson, M., & Mould, J. 1985, ApJ, 290, 191 [NASA ADS] [CrossRef] [Google Scholar]
- Armandroff, T. E., & Da Costa, G. S. 1991, AJ, 101, 1329 [NASA ADS] [CrossRef] [Google Scholar]
- Armandroff, T. E., Da Costa, G. S., Caldwell, N., & Seitzer, P. 1993, AJ, 106, 986 [NASA ADS] [CrossRef] [Google Scholar]
- Battaglia, G., Tolstoy, E., Helmi, A., et al. 2006, A&A, 459, 423 [NASA ADS] [CrossRef] [EDP Sciences] [Google Scholar]
- Battaglia, G., Helmi, A., Tolstoy, E., et al. 2008a, ApJ, 681, L13 [Google Scholar]
- Battaglia, G., Irwin, M., Tolstoy, E., et al. 2008b, MNRAS, 383, 183 [Google Scholar]
- Battaglia, G., Tolstoy, E., Helmi, A., et al. 2011, MNRAS, 411, 1013 [NASA ADS] [CrossRef] [MathSciNet] [Google Scholar]
- Battinelli, P., & Demers, S. 2004, A&A, 417, 479 [NASA ADS] [CrossRef] [EDP Sciences] [Google Scholar]
- Bellazzini, M., Gennari, N., & Ferraro, F. R. 2005, MNRAS, 360, 185 [NASA ADS] [CrossRef] [Google Scholar]
- Bird, S., Harris, W. E., Blakeslee, J. P., & Flynn, C. 2010, A&A, 524, A71 [NASA ADS] [CrossRef] [EDP Sciences] [Google Scholar]
- Bosler, T. L., Smecker-Hane, T. A., & Stetson, P. B. 2007, MNRAS, 378, 318 [NASA ADS] [CrossRef] [Google Scholar]
- Caldwell, N. 2006, AJ, 651, 822 [Google Scholar]
- Caldwell, N., Armandroff, T. E., Da Costa, G. S., & Seitzer, P. 1998, AJ, 115, 535 [NASA ADS] [CrossRef] [Google Scholar]
- Carrera, R., Gallart, C., Pancino, E., & Zinn, R. 2007, AJ, 134, 1298 [NASA ADS] [CrossRef] [Google Scholar]
- Carretta, E., & Gratton, R. G. 1997, A&AS, 121, 95 [NASA ADS] [CrossRef] [EDP Sciences] [Google Scholar]
- Carretta, E., Bragaglia, A., Gratton, R. G., D’Orazi, V., & Lucatello, S. 2009, A&A, 508, 695 [NASA ADS] [CrossRef] [EDP Sciences] [Google Scholar]
- Cohen, J. G., & Huang, W. 2009, ApJ, 701, 1053 [NASA ADS] [CrossRef] [Google Scholar]
- Cohen, J. G., & Huang, W. 2010, ApJ, 719, 931 [NASA ADS] [CrossRef] [Google Scholar]
- Cole, A. A., Smecker-Hane, T. A., & Gallagher, J. S., III 2000, AJ, 120, 1808 [NASA ADS] [CrossRef] [Google Scholar]
- Cole, A. A., Smecker-Hane, T. A., Tolstoy, E., Bosler, T. L., & Gallagher, J. S. 2004, MNRAS, 347, 367 [NASA ADS] [CrossRef] [Google Scholar]
- Coleman, M. G., & de Jong, J. T. A. 2008, ApJ, 685, 933 [NASA ADS] [CrossRef] [Google Scholar]
- Coleman, M. G., Da Costa, G. S., & Bland-Hawthorn, J. 2005, AJ, 130, 1065 [NASA ADS] [CrossRef] [Google Scholar]
- Crnojevic, D., Grebel, E. K., & Koch, A. 2010, A&A, 516, A85 [NASA ADS] [CrossRef] [EDP Sciences] [Google Scholar]
- Crnojevic, D., Rejkuba, M., Grebel, E. K., Da Costa, G., & Jerjen, H. 2011, A&A, 530, A58 [NASA ADS] [CrossRef] [EDP Sciences] [Google Scholar]
- Da Costa, G. S. 2004, PASA, 21, 366 [Google Scholar]
- Da Costa, G. S., & Armandroff, T. E. 1990, AJ, 100, 162 [NASA ADS] [CrossRef] [Google Scholar]
- Da Costa, G. S., & Armandroff, T. E. 1995, AJ, 109, 2533 [NASA ADS] [CrossRef] [Google Scholar]
- Da Costa, G. S., & Hatzidimitriou, D. 1998, AJ, 115, 1934 [NASA ADS] [CrossRef] [Google Scholar]
- Davidge, T. J. 2005, AJ, 130, 2087 [NASA ADS] [CrossRef] [Google Scholar]
- de Boer, T. J. L., Tolstoy, E., Saha, A., et al. 2011, A&A, 528, A119 [NASA ADS] [CrossRef] [EDP Sciences] [Google Scholar]
- Dotter, A., Chaboyer, B., Jevremovic, D., et al. 2007, AJ, 134, 376 [NASA ADS] [CrossRef] [Google Scholar]
- Dotter, A., Chaboyer, B., Jevremovic, D., et al. 2008, ApJS, 178, 89 [NASA ADS] [CrossRef] [Google Scholar]
- Dotter, A., Sarajedini, A., Anderson, J., et al. 2010, ApJ, 708, 698 [NASA ADS] [CrossRef] [Google Scholar]
- Frayn, C. M., & Gilmore, G. F. 2002, MNRAS, 337, 445 [NASA ADS] [CrossRef] [Google Scholar]
- Gallart, C., Zoccali, M., & Aparicio, A. 2005, ARA&A, 43, 387 [NASA ADS] [CrossRef] [Google Scholar]
- Geisler, D., Wallerstein, G., Smith, V. V., & Casetti-Dinescu, D. I. 2007, PASP, 119, 939 [NASA ADS] [CrossRef] [Google Scholar]
- Girardi, L., Williams, B. F., Gilbert, K. M., et al. 2010, ApJ, 724, 1030 [NASA ADS] [CrossRef] [Google Scholar]
- Glatt, K., Gallagher, J. S., III, Grebel, E. K., et al. 2008a, AJ, 135, 1106 [NASA ADS] [CrossRef] [Google Scholar]
- Glatt, K., Grebel, E. K., Sabbi, E., et al. 2008b, AJ, 136, 1703 [NASA ADS] [CrossRef] [Google Scholar]
- Grebel, E. K. 1997, RvMA, 10, 29 [Google Scholar]
- Grebel, E. K. 2001, Ap&SS, 277, 231 [Google Scholar]
- Grebel, E. K., & Guhathakurta P. 1999, ApJ, 511, 101 [NASA ADS] [CrossRef] [Google Scholar]
- Grebel, E. K., & Gallagher, J. S., III 2004, ApJ, 610, 89 [Google Scholar]
- Grebel, E. K., & Stetson, P. B. 1999, in The Stellar Content of the Local Group, ed. P. Whitelock, & R. Cannon (San Francisco: ASP), IAU Symp., 192, 165 [Google Scholar]
- Grebel, E. K., & Gallagher, J. S., III, & Harbeck, D. 2003, AJ, 125, 1926 [NASA ADS] [CrossRef] [Google Scholar]
- Groenewegen, M. A. T. 2007, in Why Galaxies Care About AGB Stars: Their Importance as Actors and Probes, ed. F. Kerschbaum, C. Charbonnel, & R. F. Wing (San Francisco: ASP), ASP Conf. Ser., 378, 433 [Google Scholar]
- Gullieuszik, M., Held, E. V., Rizzi, L., et al. 2007, A&A, 467, 1025 [NASA ADS] [CrossRef] [EDP Sciences] [Google Scholar]
- Gullieuszik, M., Held, E. V., Rizzi, L., et al. 2008, MNRAS, 388, 1185 [NASA ADS] [CrossRef] [Google Scholar]
- Harbeck, D., Grebel, E. K., Holtzman, J., et al. 2001, AJ, 122, 3092 [NASA ADS] [CrossRef] [Google Scholar]
- Harris, G. L. H., & Harris, W. E. 2000, AJ, 120, 2423 [NASA ADS] [CrossRef] [Google Scholar]
- Harris, G. L. H., Harris, W. E., & Poole, G. B. 1999, AJ, 117, 855 [NASA ADS] [CrossRef] [Google Scholar]
- Hurley-Keller, D., Mateo, M., & Grebel, E. K. 1999, ApJ, 523, 25 [Google Scholar]
- Hurley-Keller, D., Mateo, M., & Nemec, J. 1998, AJ, 115, 1840 [NASA ADS] [CrossRef] [Google Scholar]
- Ikuta C., & Arimoto N. 2002, A&A, 391, 55 [NASA ADS] [CrossRef] [EDP Sciences] [Google Scholar]
- Irwin, M., & Hatzidimitriou, D. 1995, MNRAS, 277, 1354 [NASA ADS] [CrossRef] [Google Scholar]
- Kalirai, J. S., Gilbert, K. M., Guhathakurta, P., et al. 2006, ApJ, 648, 389 [NASA ADS] [CrossRef] [Google Scholar]
- Kirby, E. N., Guhathakurta, P., & Sneden, C. 2008, ApJ, 682, 1217 [NASA ADS] [CrossRef] [Google Scholar]
- Kirby, E. N., Guhathakurta, P., Bolte, M., Sneden, C., & Geha, M. C. 2009, ApJ, 705, 328 [NASA ADS] [CrossRef] [Google Scholar]
- Kirby, E. N., Guhathakurta, P., Simon, J. D., et al. 2010, ApJS, 191, 352 [NASA ADS] [CrossRef] [Google Scholar]
- Koch, A. 2009, AN, 330, 675 [Google Scholar]
- Koch, A., & McWilliam, A. 2008, AJ, 135, 1551 [NASA ADS] [CrossRef] [Google Scholar]
- Koch, A., & McWilliam, A. 2011, AJ, submitted [Google Scholar]
- Koch, A., Grebel, E. K., Wyse, R. F. G., et al. 2006, AJ, 131, 895 [NASA ADS] [CrossRef] [Google Scholar]
- Koch, A., Grebel, E. K., Kleyna, J. T., et al. 2007, AJ, 133, 270 [NASA ADS] [CrossRef] [Google Scholar]
- Koch, A., Grebel, E. K., Gilmore, G. F., et al. 2008a, AJ, 135, 1580 [NASA ADS] [CrossRef] [Google Scholar]
- Koch, A., Rich, R. M., Reitzel, D. B., et al. 2008b, ApJ, 689, 958 [NASA ADS] [CrossRef] [Google Scholar]
- Kraft, R. P., & Ivans, I. I. 2003, PASP, 115, 143 [NASA ADS] [CrossRef] [Google Scholar]
- Lanfranchi, G. A., & Matteucci, F. 2010, A&A, 512, A85 [NASA ADS] [CrossRef] [EDP Sciences] [Google Scholar]
- Lanfranchi, G. A., Matteucci, F., & Cescutti, G. 2006, A&A, 453, 67 [NASA ADS] [CrossRef] [EDP Sciences] [Google Scholar]
- Lee, M. G. 1995, AJ, 110, 1155 [NASA ADS] [CrossRef] [Google Scholar]
- Lee, M. G., Freedman, W. L., & Madore, B. F. 1993, ApJ, 417, 553 [Google Scholar]
- Lee, M. G., Park, H. S., Park, J.-H., et al. 2003, AJ, 126, 2840 [NASA ADS] [CrossRef] [Google Scholar]
- Lee, M. G., Yuk, I.-S., Park, H. S., et al. 2009, ApJ, 703, 692 [NASA ADS] [CrossRef] [Google Scholar]
- Letarte, B., Hill, V., Tolstoy, E., et al. 2010, A&A, 523A, 17 [Google Scholar]
- Lianou, S., Grebel, E. K., & Koch, A. 2010, A&A, 521, A43 [NASA ADS] [CrossRef] [EDP Sciences] [Google Scholar]
- Marcolini, A., D’Ercole, A., Battaglia, G., & Gibson B. K. 2008, MNRAS, 386, 2173 [NASA ADS] [CrossRef] [Google Scholar]
- Mateo, M. L. 1998, ARA&A, 36, 435 [NASA ADS] [CrossRef] [Google Scholar]
- Menzies, J. W., Feast, M. W., Whitelock, P. A., & Matsunaga, N. 2011, MNRAS, in press [arXiv:1103.1739v1] [Google Scholar]
- Mighell, K. J. 1997, AJ, 114, 1458 [NASA ADS] [CrossRef] [Google Scholar]
- Mighell, K. J., & Rich, R. M. 1996, AJ, 111, 777 [NASA ADS] [CrossRef] [Google Scholar]
- Monelli, M., Pulone, L., & Corsi, C. E., et al. 2003, AJ, 126, 218 [NASA ADS] [CrossRef] [Google Scholar]
- Monkiewicz, J., Mould, J. R., Gallagher, J. S., III, et al. 1999, PASP, 111, 1392 [NASA ADS] [CrossRef] [Google Scholar]
- Mouhcine, M., Rich, R. M., Ferguson, H. C., Brown, T. M., & Smith, T. E. 2005, ApJ, 633, 828 [NASA ADS] [CrossRef] [Google Scholar]
- Mould, J. R., Kristian, J., & Da Costa, G. S. 1983, ApJ, 270, 471 [NASA ADS] [CrossRef] [Google Scholar]
- Orban, C., Gnedin, O. Y., Weisz, D. R., et al. 2008, ApJ, 686, 1030 [NASA ADS] [CrossRef] [Google Scholar]
- Pont, F., Zinn, R., Gallart, C., Hardy, E., & Winnick, R. 2004, AJ, 127, 840 [NASA ADS] [CrossRef] [Google Scholar]
- Rejkuba, M., da Costa, G. S., Jerjen, H., Zoccali, M., & Binggeli, B. 2006, A&A, 448, 983 [NASA ADS] [CrossRef] [EDP Sciences] [Google Scholar]
- Revaz, Y., Jablonka, P., Sawala, T., et al. 2009, A&A, 501, 189 [NASA ADS] [CrossRef] [EDP Sciences] [Google Scholar]
- Rizzi, L., Held, E. V., Bertelli, G., & Saviane, I. 2003, ApJ, 589, L85 [NASA ADS] [CrossRef] [Google Scholar]
- Rizzi, L., Held, E. V., Saviane, I., Tully, R. B., & Gullieuszik, M. 2007, MNRAS, 380, 1255 [NASA ADS] [CrossRef] [MathSciNet] [Google Scholar]
- Rutledge, G. A., Hesser, J. E., & Stetson, P. B. 1997, PASP, 109, 907 [NASA ADS] [CrossRef] [Google Scholar]
- Sarajedini, A., Grebel, E. K., Dolphin, A. E., et al. 2002, ApJ, 567, 915 [NASA ADS] [CrossRef] [Google Scholar]
- Salaris, M., Cassisi, S., & Weiss, A. 2002, PASP, 114, 375 [NASA ADS] [CrossRef] [Google Scholar]
- Saviane, I., Rosenberg, A., Piotto, G., & Aparicio, A. 2000a, A&A, 355, 966 [NASA ADS] [Google Scholar]
- Saviane, I., Held, E. V., & Bertelli, G. 2000b, A&A, 355, 56 [NASA ADS] [Google Scholar]
- Shetrone, M. D., Siegel, M. H., Cook, D. O., & Bosler, T. 2009, AJ, 137, 62 [NASA ADS] [CrossRef] [Google Scholar]
- Smecker-Hane, T. A., Stetson, P. B., Hesser, J. E., & Lehnert, M. D. 1994, AJ, 108, 507 [NASA ADS] [CrossRef] [Google Scholar]
- Smecker-Hane, T. A., Stetson, P. B., Hesser, J. E., & Vandenberg, D. A. 1996, in From Stars to Galaxies: The Impact of Stellar Physics on Galaxy Evolution, ed. C. Leitherer, U. Fritze-von Alvensleben, & J. Huchra (San Francisco: ASP), ASP Conf. Ser., 98, 328 [Google Scholar]
- Starkenburg, E., Hill, V., Tolstoy, E., et al. 2010, A&A, 513, A34 [NASA ADS] [CrossRef] [EDP Sciences] [Google Scholar]
- Stetson, P. B., Hesser, J. E., & Smecker-Hane, T. A. 1998, PASP, 110, 533 [NASA ADS] [CrossRef] [Google Scholar]
- Tafelmeyer, M., Jablonka, P., Hill, V., et al. 2010, A&A, 524, A58 [NASA ADS] [CrossRef] [EDP Sciences] [Google Scholar]
- Tolstoy, E., Irwin, M. J., Helmi, A., et al. 2004, ApJ, 617, 119 [Google Scholar]
- Tolstoy, E., Hill, V., & Tosi, M. 2009, ARA&A, 47, 371 [NASA ADS] [CrossRef] [Google Scholar]
- Venn, K. A., Irwin, M., Shetrone, M. D., et al. 2004, AJ, 128, 1177 [NASA ADS] [CrossRef] [Google Scholar]
- Walker, M. G., Mateo, M., & Olszewski, E. W., et al. 2006, AJ, 131, 211 [Google Scholar]
- Walker, M. G., Mateo, M., & Olszewski, E. W. 2007, ApJS, 171, 389 [NASA ADS] [CrossRef] [Google Scholar]
- Walker, M. G., Mateo, M., & Olszewski, E. W. 2009a, AJ, 137, 3100 [NASA ADS] [CrossRef] [Google Scholar]
- Walker, M. G., Mateo, M.,Olszewski, E. W., et al. 2009b, ApJ, 704, 1274 [NASA ADS] [CrossRef] [Google Scholar]
- Whitelock, P. A., Menzies, J. W., Feast, M. W., et al. 2009, MNRAS, 394, 795 [NASA ADS] [CrossRef] [Google Scholar]
- Zinn, R., & West, M. J. 1984, ApJS, 55, 45 [NASA ADS] [CrossRef] [Google Scholar]
All Tables
Mean metallicity properties corresponding to the mixture of stellar fractions as described in Sect. 4.1.2.
All Figures
|
Fig. 1 Color–magnitude diagrams of the five Galactic dSphs, shown as small grey dots. Dartmouth isochrones are overplotted as solid lines, for a fixed age of 12.5 Gyr, a range in metallicities from −2.5 to −1 dex, and a step size of 0.5 dex. The thick black dots correspond to the stars in common to the photometric and Ca T-based spectroscopic sample. The error bars correspond to the photometric errors. In the CMD of Sculptor, the red and blue asterisks indicate the location of the extremely metal-poor stars with a high-resolution iron abundance of −3.96 dex and −3.48 dex, respectively, identified by Tafelmeyer et al. (2010; red: Scl 07–50; blue: Scl 07–49), while the photometric metallicities obtained for the same stars are −2.55 dex and −2.71 dex, respectively. In the CMD of Fornax, again the red asterisk indicates the location of the extremely metal-poor star with a high-resolution iron abundance of − 3.66 dex (Tafelmeyer et al. 2010; Frx 05–42), while the photometric metallicity assigned to the same star is − 2.98 dex. |
| In the text | |
|
Fig. 2 Left panels: the white histograms show the photometric MDFs of all the stars within 3 mag below the TRGB, for Sculptor, Sextans, Carina, Fornax, and Leo II, while the shaded histograms show the same but only for the common stars. Middle panels: the white histograms show the Ca T-based MDFs on the CG97 metallicity scale for the full available spectroscopic sample, as described on the text, while the shaded histograms show the same but only for the stars in common. Right panels: the white histograms show the Ca T-based MDFs on the isoscale (discussed in Sect. 3.3), while the shaded histograms show the same but only for the common stars. In all panels, the vertical black dashed line corresponds to the median metallicity of the full sample, while the grey dashed line corresponds to the one of the common stars. The vertical dotted-dashed line in all panels corresponds to the isoschrone’s metal-poor limit of roughly −2.5 dex. Note that for Sextans on the isoscale MDF (right panel), the total number of the common stars is three (shaded histogram), while the one for the full sample is twelve (white histogram). |
| In the text | |
|
Fig. 3 Upper panel: galactic GC fiducials from DA90 shown as black dashed lines, along with Dartmouth isochrones shown as red solid lines. From left to right, the Galactic GC fiducials correspond to M 15, NGC 6397, M 2 and 47 Tuc, where the GCs have a metallicity of −2.17, −1.91, −1.58 and −0.71 dex, respectively, on the ZW84 scale. The isochrones correspond to an age of 12.5 Gyr and have the same metallicities as the Galactic GCs, from left to right. Middle panel: analytic functions of Galactic GC fiducial loci from Saviane et al. (2000a) on the ZW84 scale (black dashed lines) along with Dartmouth isochrones of 12.5 Gyr (red solid lines). The metallicities correspond to −1.99, −1.37, −1.23, −1.15, and − 0.7 dex from left to right, respectively. Lower panel: the same as in the middle panel but for the CG97 metallicity scale. The metallicities correspond to −2.11, −1.67, −1.53, −1.33, and −0.71 dex from left to right, respectively. |
| In the text | |
|
Fig. 4 Transformation from the CG97 metallicity scale to the Dartmouth isochrone metallicity scale, simply called “isoscale”. The red thick dashed line corresponds to the error-weighted linear least squares fit to the data. The black thin dashed line corresponds to unity. |
| In the text | |
|
Fig. 5 The white histograms show the MRS MDFs for the full available MRS sample for Sculptor, Sextans, Fornax, and Carina. The shaded histograms show the MRS MDFs for the stars in common to both the MRS and photometric samples. In all panels, the vertical black dashed line corresponds to the median metallicity value of the full sample, while the grey dashed line corresponds to the median metallicity value of the common stars. The vertical dotted-dashed line corresponds to the lower limit of the most metal-poor isochrone used of roughly −2.5 dex. |
| In the text | |
|
Fig. 6 V-band magnitude versus the difference in spectroscopic minus the photometric metallicities on the isoscale for Sculptor, Carina, Fornax, and Leo II. |
| In the text | |
|
Fig. 7 Dartmouth isochrones for an age of 12.5 Gyr (black dashed) and 7 Gyr (red solid). The intermediate-age isochrone lies bluewards from the older isochrone at a fixed metallicity. Note that for a constant age and different values of [Fe/H] the slope of the RGB changes, while for a varying age and a constant [Fe/H] the slope of the RGB changes very little. |
| In the text | |
|
Fig. 8 The first two rows show, from left to right, the photometric versus the Ca T spectroscopic metallicities (upper panels), as well as the residuals of the comparison (lower panels), on the CG97 metallicity scale and on the isoscale for Carina, Fornax, and Leo II. The last row shows the same for Sculptor. The error-weighted contours range from 0.5 to 2.5σ in steps of 0.5. The upper panel dashed line indicates unity. |
| In the text | |
|
Fig. 9 Photometric metallicities versus MRS metallicities (upper panels), as well as their residuals (lower panels), in the sense of MRS metallicities minus photometric metallicities versus MRS metallicities, for Sculptor, Sextans, Fornax and Leo II. The error-weighted contours range from 0.5 to 2.5σ in steps of 0.5. The upper panel dashed line indicates unity. |
| In the text | |
|
Fig. 10 Photometric metallicity, as well as the residuals, as a function of the high-resolution spectroscopic metallicity. The error-weighted contours range from 0.5 to 2.5σ in steps of 0.5. The upper panel dashed line indicates unity. |
| In the text | |
|
Fig. 11 From left to right, the upper panels show the Ca T spectroscopic metallicities versus the MRS metallicities for Sculptor, Sextans, Fornax, and Leo II, while the lower panels show their residuals. The error-weighted contours range from 0.5 to 2.5σ in steps of 0.5. The upper panel dashed line indicates unity. |
| In the text | |
|
Fig. 12 Slopes of the error-weighted linear least squares fit to the datapoints of the lower panels of Figs. 8 and 9 as a function of the intermediate-age fractions ( f10 G − f1 G, upper panels; f10 G − f5 G; middle panels), as well as a function of the mass-weighted mean age τ (lower panels), for Sculptor, Sextans, Carina, Fornax and Leo II. The red solid line corresponds to an error-weighted linear least squares fit to the data. The error bars correspond to the error of the coefficients of the fit to the datapoints of Figs. 8 and 9. |
| In the text | |
Current usage metrics show cumulative count of Article Views (full-text article views including HTML views, PDF and ePub downloads, according to the available data) and Abstracts Views on Vision4Press platform.
Data correspond to usage on the plateform after 2015. The current usage metrics is available 48-96 hours after online publication and is updated daily on week days.
Initial download of the metrics may take a while.