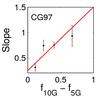
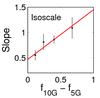
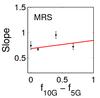
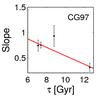
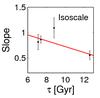
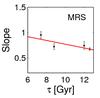
Fig. 12
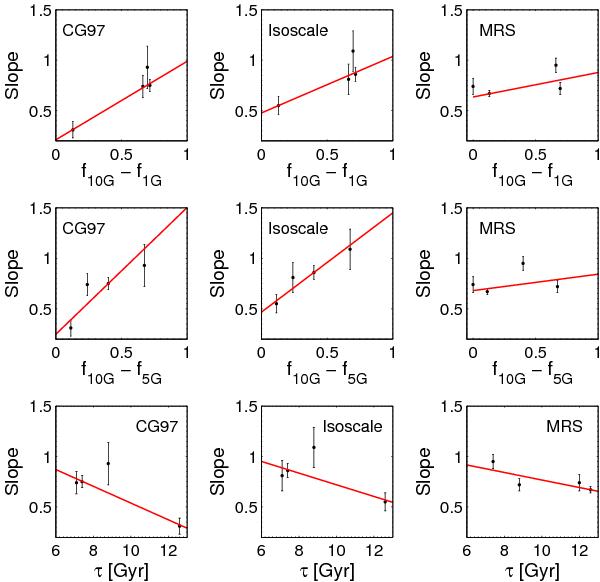
Slopes of the error-weighted linear least squares fit to the datapoints of the lower panels of Figs. 8 and 9 as a function of the intermediate-age fractions ( f10 G − f1 G, upper panels; f10 G − f5 G; middle panels), as well as a function of the mass-weighted mean age τ (lower panels), for Sculptor, Sextans, Carina, Fornax and Leo II. The red solid line corresponds to an error-weighted linear least squares fit to the data. The error bars correspond to the error of the coefficients of the fit to the datapoints of Figs. 8 and 9.
Current usage metrics show cumulative count of Article Views (full-text article views including HTML views, PDF and ePub downloads, according to the available data) and Abstracts Views on Vision4Press platform.
Data correspond to usage on the plateform after 2015. The current usage metrics is available 48-96 hours after online publication and is updated daily on week days.
Initial download of the metrics may take a while.