Free Access
Fig. 9
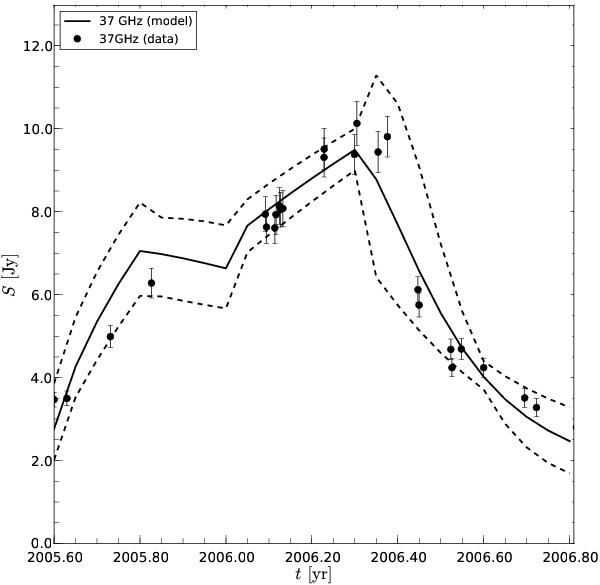
Modeled and observed 37 GHz light curve. The black solid line corresponds to the calculated model and the dashed lines indicate the uncertainties in the calculation of the modeled light curve (for more details see text).
Current usage metrics show cumulative count of Article Views (full-text article views including HTML views, PDF and ePub downloads, according to the available data) and Abstracts Views on Vision4Press platform.
Data correspond to usage on the plateform after 2015. The current usage metrics is available 48-96 hours after online publication and is updated daily on week days.
Initial download of the metrics may take a while.