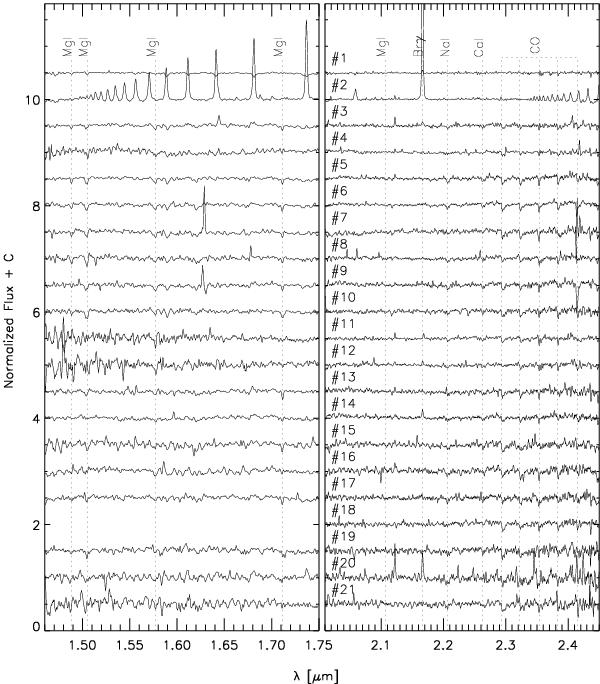
Fig. 8

Normalized SINFONI H-band (left) and K-band (right) spectra of the first 21 objects. For most of these objects we were able to derive the spectral type (Table 2). The location of some of the absorption lines used for the classification of the stars are shown by the vertical dashed lines. The combination of Mg i , Na i and Ca i absorption lines proved to be the best temperature tracers. The width of the CO lines in the K-band gives an indication of the luminosity class.
Current usage metrics show cumulative count of Article Views (full-text article views including HTML views, PDF and ePub downloads, according to the available data) and Abstracts Views on Vision4Press platform.
Data correspond to usage on the plateform after 2015. The current usage metrics is available 48-96 hours after online publication and is updated daily on week days.
Initial download of the metrics may take a while.


