Free Access
Fig. 4
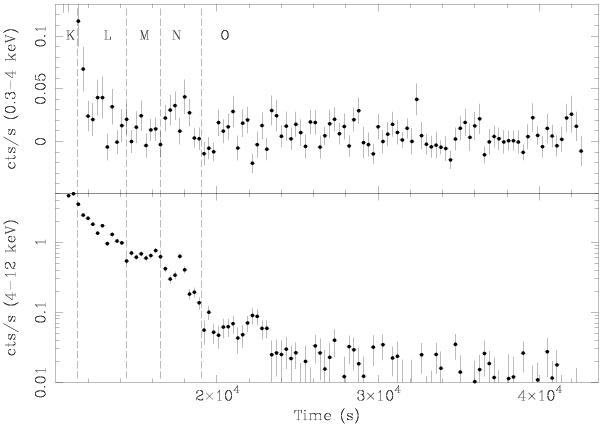
Final part of the decay after the flare observed by XMM-Newton. The upper (lower) panel shows the source lightcurve in the 0.3–4 keV (4–12 keV) energy band. We marked with vertical dashed lines the time intervals during which major changes in the source spectrum occurred (spectra K, L, M, N, O in Table 1 and Fig. 8).
Current usage metrics show cumulative count of Article Views (full-text article views including HTML views, PDF and ePub downloads, according to the available data) and Abstracts Views on Vision4Press platform.
Data correspond to usage on the plateform after 2015. The current usage metrics is available 48-96 hours after online publication and is updated daily on week days.
Initial download of the metrics may take a while.