Free Access
Fig. 12
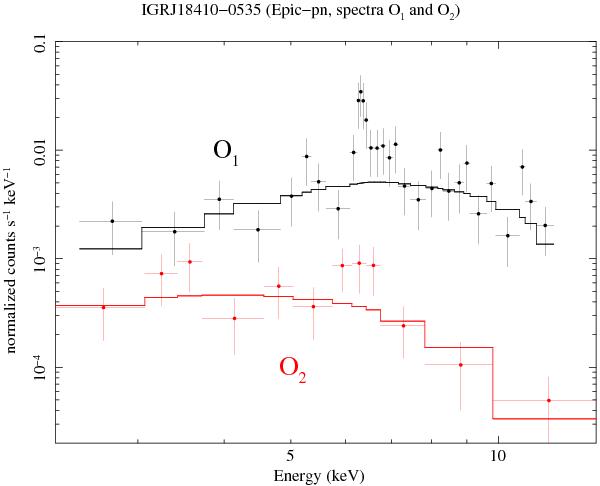
The two spectra O1 and O2 extracted during the fist ~3 ks and the last ~17 ks of the time interval O in Table 1. To facilitate the visual comparison, we used in this figure a grouping of 5 photons per bin for both spectra. We show the fit obtained with a simple power-law model to highlight the iron line at ~6.4 keV.
Current usage metrics show cumulative count of Article Views (full-text article views including HTML views, PDF and ePub downloads, according to the available data) and Abstracts Views on Vision4Press platform.
Data correspond to usage on the plateform after 2015. The current usage metrics is available 48-96 hours after online publication and is updated daily on week days.
Initial download of the metrics may take a while.