Fig. 10
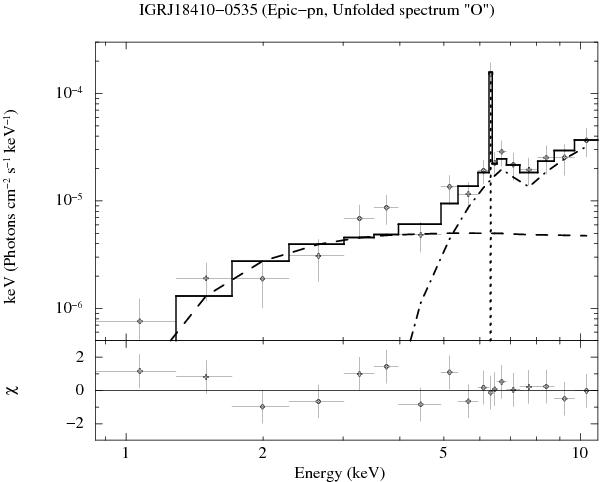
Unfolded Epic-pn spectrum of IGR J18410-0535 during the interval O in Table 1. The best-fit model in Xspec here is phabs1*(pow1+Gauss+phabs2*pow2). The value of phabs1 was fixed in the fit to 1.8 × 1022 cm-2 and the photon index of the two power laws was forced to be the same (see Sect. 2.2 for details). The dashed line corresponds to the less absorbed power-law component in the fit, and the dot-dashed line to the more absorbed one. The dotted line indicates the iron line component at ~ 6.4 keV. The bottom panel shows the residuals from the fit.
Current usage metrics show cumulative count of Article Views (full-text article views including HTML views, PDF and ePub downloads, according to the available data) and Abstracts Views on Vision4Press platform.
Data correspond to usage on the plateform after 2015. The current usage metrics is available 48-96 hours after online publication and is updated daily on week days.
Initial download of the metrics may take a while.