Open Access
Fig. 3
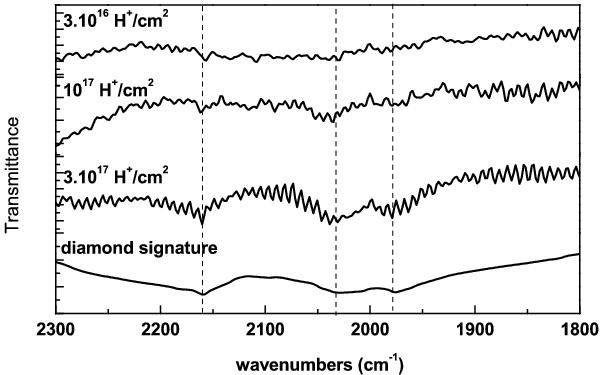
The IR SiH band region for the three irradiated samples, compared to the diamond signatures in the same range. For each plot, the corresponding fluence is given on the left. For a rapid visual comparison we merged different plots and did not scale the transmittance axis.
Current usage metrics show cumulative count of Article Views (full-text article views including HTML views, PDF and ePub downloads, according to the available data) and Abstracts Views on Vision4Press platform.
Data correspond to usage on the plateform after 2015. The current usage metrics is available 48-96 hours after online publication and is updated daily on week days.
Initial download of the metrics may take a while.