Fig. 5
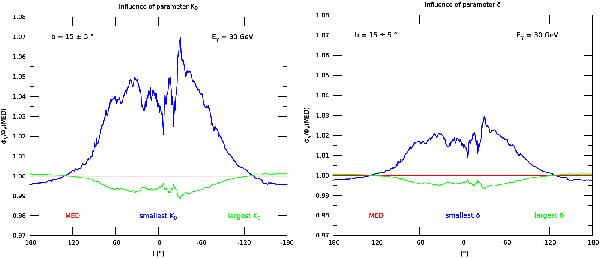
Variations in the γ-ray flux relative to the reference case of Fig. 4. The red line is obtained when all the propagation parameters are extracted from the Med set of Table 1. Left panel: changing only the normalization K0 of the space diffusion coefficient from its Med value to the lowest (1.6 × 10⁻³ kpc2/Myr) and highest (7.65 × 10⁻² kpc2/Myr) values allowed by the B/C analysis yields the blue and green curves respectively. Right panel: same as in the left panel but varying the spectral index δ instead of the normalization K0. The blue and green curves are derived from the smallest (0.46) and largest (0.85) values of the spectral index respectively.
Current usage metrics show cumulative count of Article Views (full-text article views including HTML views, PDF and ePub downloads, according to the available data) and Abstracts Views on Vision4Press platform.
Data correspond to usage on the plateform after 2015. The current usage metrics is available 48-96 hours after online publication and is updated daily on week days.
Initial download of the metrics may take a while.