Fig. 3
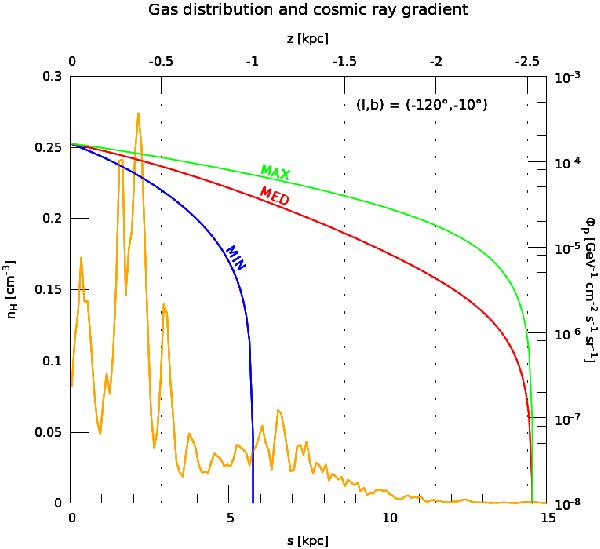
The gas density (orange with units on the left y-axis) and the CR proton flux Φp(x) (units on the right y-axis) are plotted along the los in the direction specified by the Galactic longitude and latitude (l,b) = (−120°,−10°). The three models of Table 1 have been considered for the calculation of the proton flux. They lead to the blue (Min), red (Med) and green (Max) curves. As an illustration, the CR proton total energy Ep = mp + T has been set equal to 30 GeV. The relative distribution of primary nuclei along the los is not expected to change much with energy.
Current usage metrics show cumulative count of Article Views (full-text article views including HTML views, PDF and ePub downloads, according to the available data) and Abstracts Views on Vision4Press platform.
Data correspond to usage on the plateform after 2015. The current usage metrics is available 48-96 hours after online publication and is updated daily on week days.
Initial download of the metrics may take a while.