Free Access
Fig. 3
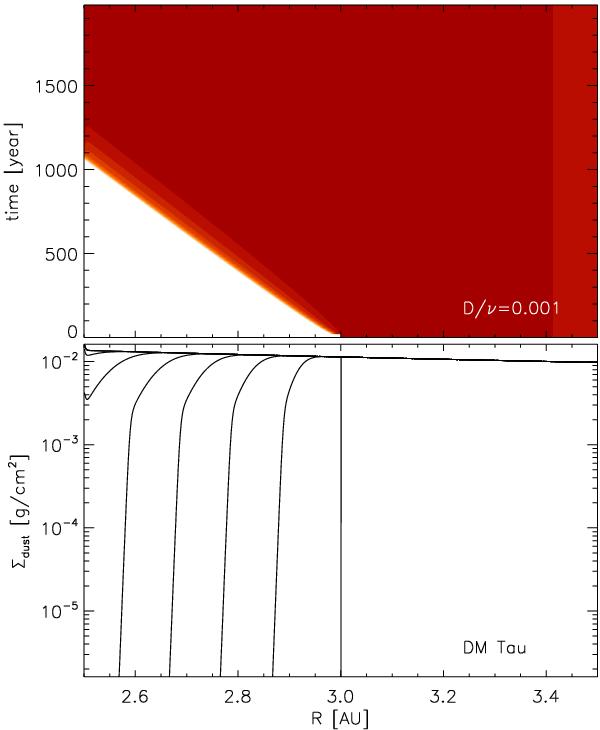
As Fig. 2, but now for the source DM Tau. Time interval between curves is 200 years. The contour levels of the top panel are steps of 100.2, i.e. five contours are one factor of 10. The level in the bottom-right corner is the initial value of the dust surface density, 1 × 10⁻² g/cm2.
Current usage metrics show cumulative count of Article Views (full-text article views including HTML views, PDF and ePub downloads, according to the available data) and Abstracts Views on Vision4Press platform.
Data correspond to usage on the plateform after 2015. The current usage metrics is available 48-96 hours after online publication and is updated daily on week days.
Initial download of the metrics may take a while.