Fig. 3
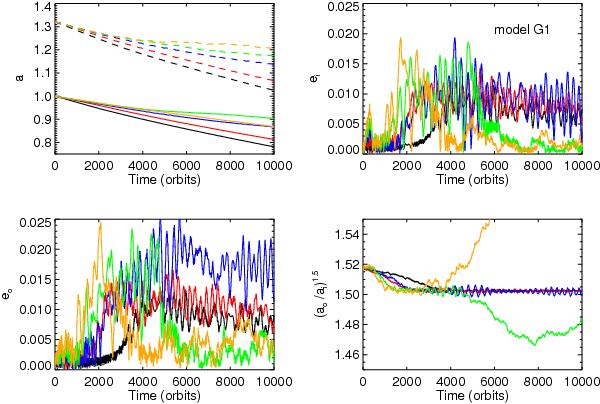
Upper left (first) panel: time evolution of planet semi-major axes for model G1 and for γ = 0 (black line), γ = 6 × 10⁻⁵ (red line), γ = 1.3 × 10⁻⁴ (blue), γ = 1.9 × 10⁻⁴ (green), and γ = 3 × 10⁻⁴ (orange). Upper right (second) panel: time evolution of the inner planet eccentricity. Third panel: time evolution of the outer planet eccentricity. Fourth panel: time evolution of the period ratio. Simulations were performed with GENESIS.
Current usage metrics show cumulative count of Article Views (full-text article views including HTML views, PDF and ePub downloads, according to the available data) and Abstracts Views on Vision4Press platform.
Data correspond to usage on the plateform after 2015. The current usage metrics is available 48-96 hours after online publication and is updated daily on week days.
Initial download of the metrics may take a while.