Free Access
Fig. 11
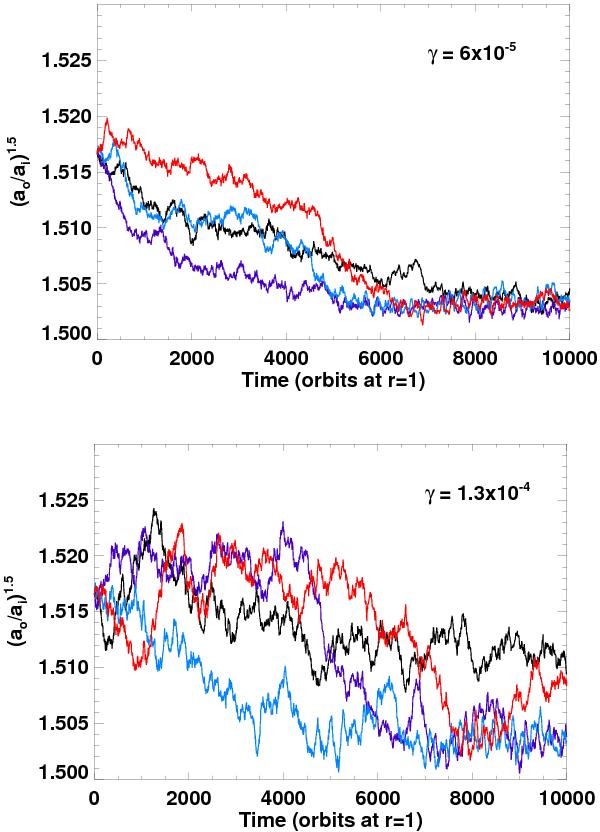
Upper panel: time evolution of the period ratio for model G1 and for four runs with γ = 6 × 10⁻⁵ and in which Eq. (3) is solved at each time step . Lower panel: same but for γ = 1.3 × 10⁻⁴. Simulations were performed with FARGO.
This figure is made of several images, please see below:
Current usage metrics show cumulative count of Article Views (full-text article views including HTML views, PDF and ePub downloads, according to the available data) and Abstracts Views on Vision4Press platform.
Data correspond to usage on the plateform after 2015. The current usage metrics is available 48-96 hours after online publication and is updated daily on week days.
Initial download of the metrics may take a while.