Fig. 1
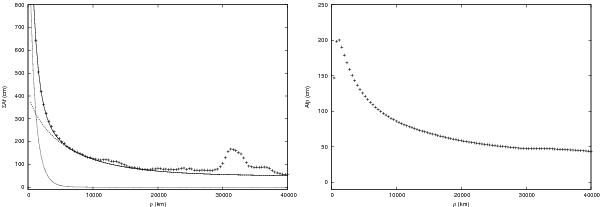
Left: measured R filter ΣAf in function of the projected nucleocentric distance ρ for observations at rh ≈ 2.3 AU together with the model functions. Crosses represent the measurements, the solid line shows the total model function, the dashed line gives the part related to Nc+Nl and the dotted line that of Ns. The “bumps” (for instance, that at about 32 000 km) are caused by the remnant flux from background stars, easily identifiable by eye in the images. Note that the profile was modeled up to 105 km, but here a smaller part is shown. Right: measured Afρ function for the same date and filter. This shows that the Afρ strongly depends on ρ and consequently it cannot be used as proxy of the dust production.
Current usage metrics show cumulative count of Article Views (full-text article views including HTML views, PDF and ePub downloads, according to the available data) and Abstracts Views on Vision4Press platform.
Data correspond to usage on the plateform after 2015. The current usage metrics is available 48-96 hours after online publication and is updated daily on week days.
Initial download of the metrics may take a while.