Fig. 8
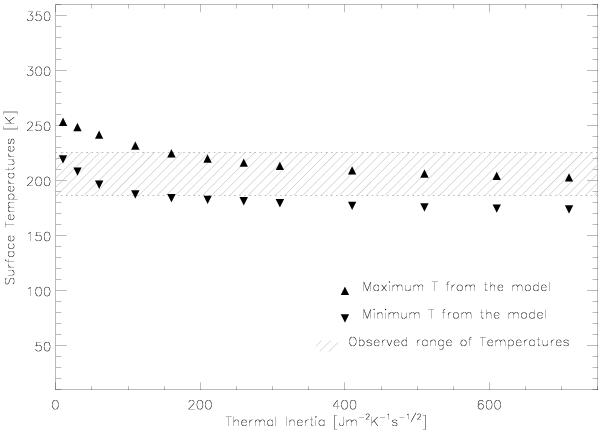
Thermal contrast detectable inside the VIRTIS field of view as a function of thermal inertia when no roughness is assumed. The filled region represents the minimum and maximum temperatures observed by VIRTIS, while the up and down triangles are the expected maximum and minimum observable temperatures for a given thermal inertia Γ respectively. Values of Γ lower than 100 J m-2 K-1 s − 1/2 and higher than 150 J m-2 K-1 s−1/2 are inconsistent with the data.
Current usage metrics show cumulative count of Article Views (full-text article views including HTML views, PDF and ePub downloads, according to the available data) and Abstracts Views on Vision4Press platform.
Data correspond to usage on the plateform after 2015. The current usage metrics is available 48-96 hours after online publication and is updated daily on week days.
Initial download of the metrics may take a while.