Fig. 7
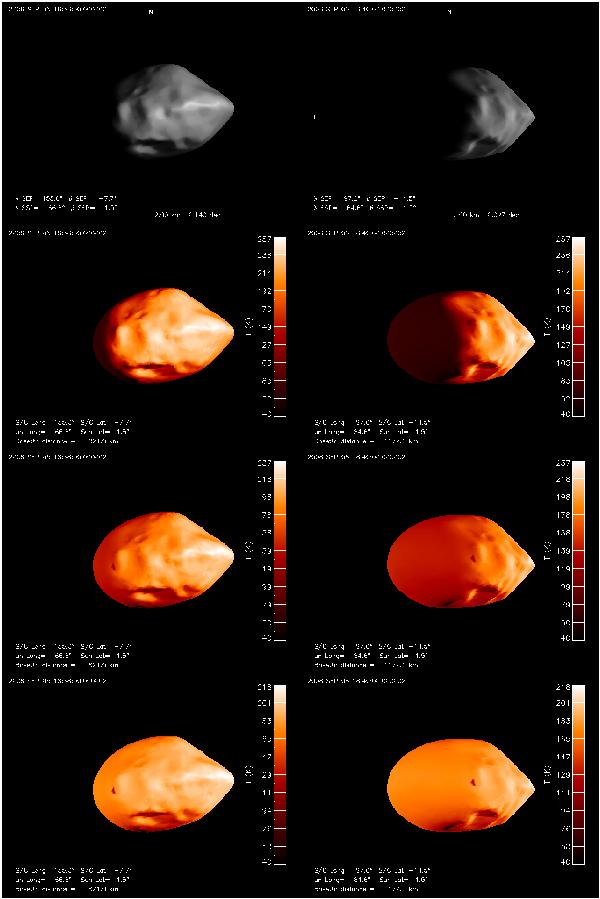
Top: simulated views of Steins obtained at the beginning (left) and at the end (right) of VIRTIS-M observations, i.e., between 18:38:19 and 18:39:22 UTC approximately. The phase angle significantly changed during the observations (see text). In color: simulated thermal maps of Steins for three different thermal inertias (from top to bottom Γ = 10 − 100 − 300 J m-2 K-1 s − 1/2). Surface temperature is color-coded according to the scale on the color bars. The VIRTIS footprints, not represented here, were located on the right side of each image (see Fig. 10).
Current usage metrics show cumulative count of Article Views (full-text article views including HTML views, PDF and ePub downloads, according to the available data) and Abstracts Views on Vision4Press platform.
Data correspond to usage on the plateform after 2015. The current usage metrics is available 48-96 hours after online publication and is updated daily on week days.
Initial download of the metrics may take a while.