Free Access
Fig. 6
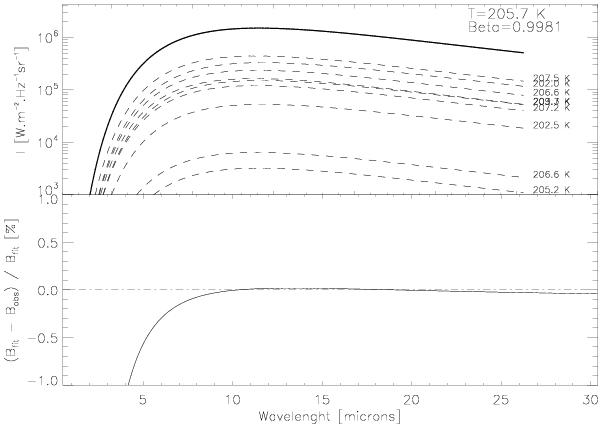
Top: dotted lines represent the Planck functions weighted by the fractional area filled by each facet (with temperature T) that intercepts the pixel (i,j). The solid line is the black body fitted to the sum of dotted lines. Bottom: deviation (in [%]) between the sum of black bodies and the fit.
Current usage metrics show cumulative count of Article Views (full-text article views including HTML views, PDF and ePub downloads, according to the available data) and Abstracts Views on Vision4Press platform.
Data correspond to usage on the plateform after 2015. The current usage metrics is available 48-96 hours after online publication and is updated daily on week days.
Initial download of the metrics may take a while.