Fig. 10
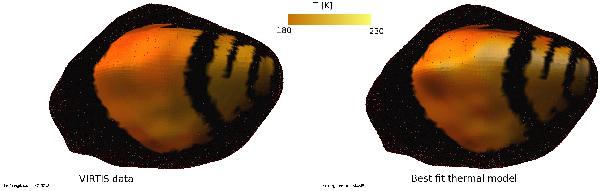
Comparison between Virtis data (left) and the best fit with the roughness model (right) with Γ = 210 J m-2 K-2 s−1/2 and ξ = 0.20. We used 41 290 facets here for a better rendening with high spatial resolution. Warm surface is in yellow, while cold regions appear in dark red. Facets that are included in the selected 104 pixels are color-coded in temperature. North is up. The morning side appears in the middle while noon local time is on the right.
Current usage metrics show cumulative count of Article Views (full-text article views including HTML views, PDF and ePub downloads, according to the available data) and Abstracts Views on Vision4Press platform.
Data correspond to usage on the plateform after 2015. The current usage metrics is available 48-96 hours after online publication and is updated daily on week days.
Initial download of the metrics may take a while.