Fig. 6
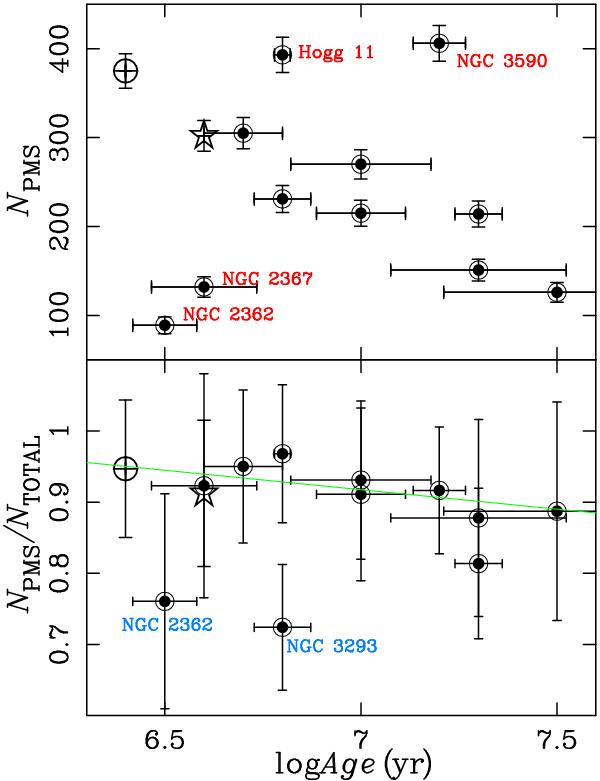
Number of PMS members (upper panel) and ratio of PMS to total member numbers (PMS+MS+postMS), plotted versus cluster age. The values for NGC 2264 (crossed circle) and NGC 1893 (star) are shown for comparison. The green line in the lower plot represents a linear fit to the points, excluding the clusters marked in red with their names in the upper plot. A correlation coefficient of 0.7 is obtained. Error bars in the age are listed in Table 1. In the vertical axis, they are calculated assuming absolute error in the numbers equal to the square root of the numbers themselves.
Current usage metrics show cumulative count of Article Views (full-text article views including HTML views, PDF and ePub downloads, according to the available data) and Abstracts Views on Vision4Press platform.
Data correspond to usage on the plateform after 2015. The current usage metrics is available 48-96 hours after online publication and is updated daily on week days.
Initial download of the metrics may take a while.