Free Access
Fig. 9
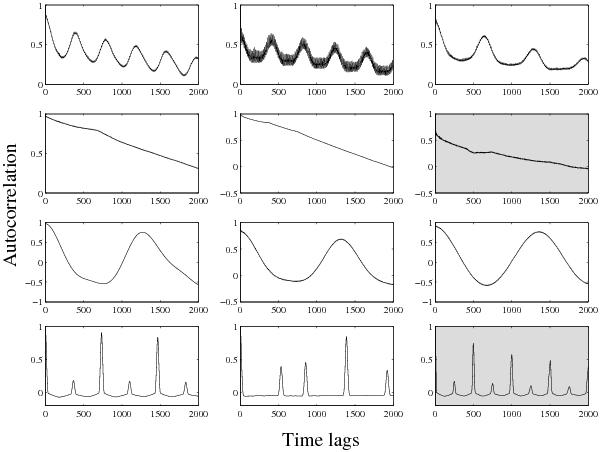
Some clustering results obtained with ACFs. Each row indicates one cluster. In the third column, second row, the ACF of the contaminated light curve of Fig. 1 is indicated. The real eclipsing binary of that example is associated with another cluster (fourth row and third column).
Current usage metrics show cumulative count of Article Views (full-text article views including HTML views, PDF and ePub downloads, according to the available data) and Abstracts Views on Vision4Press platform.
Data correspond to usage on the plateform after 2015. The current usage metrics is available 48-96 hours after online publication and is updated daily on week days.
Initial download of the metrics may take a while.