Fig. 5
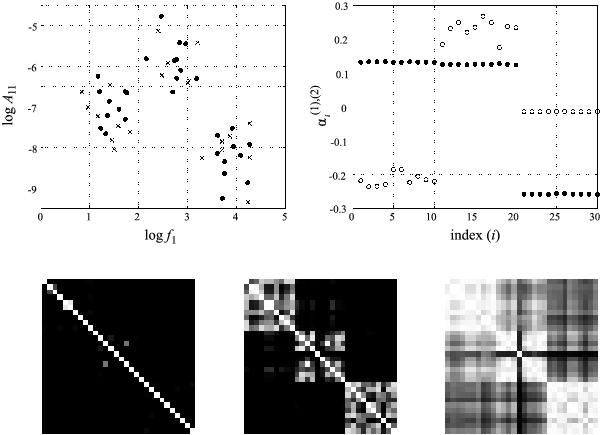
Top left: dataset. Training set (filled circles) and validation set (crosses). Top right: eigenvectors α(1)(open circles) and α(2)(filled circles) containing the clustering information for the training set. Bottom: Kernel matrices for different σ2 values. The intensity indicates how similar the points are to each other. White indicates that the points should be in the same cluster. From left to right: σ2 = 0.01, σ2 = 0.2, σ2 = 5. Note that for the first case the points are only similar to themselves. In other words, only the points in the diagonal are 1, the rest is approximately zero. For the right case, it is difficult to discriminate between some points, especially in the first two clusters (first two blocks). As the kernel parameter σ2 increases, the model becomes less able to discriminate between the clusters.
Current usage metrics show cumulative count of Article Views (full-text article views including HTML views, PDF and ePub downloads, according to the available data) and Abstracts Views on Vision4Press platform.
Data correspond to usage on the plateform after 2015. The current usage metrics is available 48-96 hours after online publication and is updated daily on week days.
Initial download of the metrics may take a while.