Fig. 15
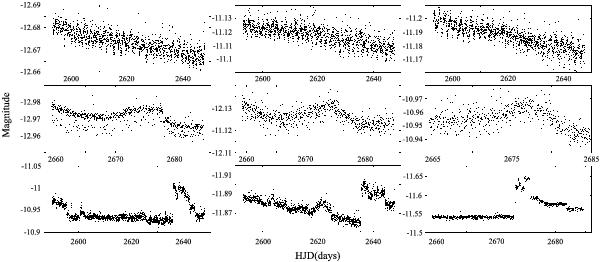
Light curves associated with cluster 15–16, 19, and 27, indicated in rows 1, 2, and 3 respectively. The first row shows examples of light curves in clusters 15 and 16, which contain pulsating variables. Cluster 19 (second row) is formed by light curves with long-term variations. The light curves assigned to the last cluster are contaminated.
Current usage metrics show cumulative count of Article Views (full-text article views including HTML views, PDF and ePub downloads, according to the available data) and Abstracts Views on Vision4Press platform.
Data correspond to usage on the plateform after 2015. The current usage metrics is available 48-96 hours after online publication and is updated daily on week days.
Initial download of the metrics may take a while.