| Issue |
A&A
Volume 531, July 2011
|
|
|---|---|---|
| Article Number | A61 | |
| Number of page(s) | 5 | |
| Section | Stellar structure and evolution | |
| DOI | https://doi.org/10.1051/0004-6361/201016249 | |
| Published online | 13 June 2011 | |
Precise orbit solution of MML 53, a low-mass, pre-main sequence eclipsing binary in Upper Centaurus Lupus
1
Department of Physics and AstronomyVanderbilt University,
Nashville,
TN 37235,
USA
e-mail: leslie.hebb@vanderbilt.edu
2
Summer REU Program, Vanderbilt University,
Nashville, Tennessee
37235,
USA
3
Astrophysics Research Centre, School of Mathematics &
Physics, Queen’s University, University Road, Belfast, BT7 1NN, UK
4
Physics Department, Fisk University, Nashville, Tennessee
37208,
USA
5
Department of Physics & Astronomy, Uppsala
University, Box
516, 751 20
Uppsala,
Sweden
Received: 1 December 2010
Accepted: 16 May 2011
Aims. We present a double-lined orbit solution for MML 53, the recently discovered low-mass pre-main sequence eclipsing binary.
Methods. Using high-resolution spectra from the SMARTS 1.5 m echelle spectrograph, we measure precise radial velocities and derive the orbital parameters of the system.
Results. The 2.1 d orbit of the eclipsing pair is circular, and we find the minimum masses of the eclipsing components to be M1sin3i = 0.97 M⊙ and M2sin3i = 0.84 M⊙, with formal uncertainties of 2.0% and an additional systematic uncertainty of ≈2.5% most likely caused by large star spots on the primary star. MML 53 has been previously identified as a member of the Upper Centaurus Lupus (UCL) star forming region (age ~15 Myr). The systemic radial velocity from our orbit solution, vγ = +1.4 ± 0.3 ± 0.8 km s-1 (statistical and systematic), is also consistent with kinematic membership in this association. In addition, we detect a change in vγ between 2006 and 2009 providing further evidence for the presence of a the third body in a wide (several year) orbit.
Key words: binaries: eclipsing / stars: pre-main sequence / binaries: spectroscopic / stars: fundamental parameters / stars: individual: MML 53
© ESO, 2011
1. Introduction
The predictions from theoretical pre-main sequence (PMS) evolutionary models provide insight into understanding star formation and evolution, timescales for circumstellar disk evolution, and planet formation (Laughlin 2000; Haisch & Lada 2001). In addition, these models are used extensively for converting observed luminosities and colors of young stars to more fundamental masses which are then used in the determination of the initial mass function (Muench et al. 2002; Elmegreen 2009). Consequently, the absolute calibration of these PMS models is of fundamental importance to star formation research. However, current models systematically under-predict dynamically determined masses by 10–30% (Hillenbrand & White 2004; Mathieu et al. 2007) and directly measured radii by up to 20% (Covino et al. 2004; Stassun et al. 2007). In addition, the absolute ages predicted by these models at ~1 Myr have systematic uncertainties of up to a factor of ten (Torres & Ribas 2002; Stassun et al. 2009). Thus, more measurements of fundamental parameters for low-mass PMS stars are needed to provide improved empirical calibration of these models.
The most accurate measurements of stellar masses, radii, effective temperatures, and luminosities, can be derived from eclipsing binary (EB) systems (Andersen 1991; Torres et al. 2010). Specifically, the calibration of the stellar age-dependent mass-radius relationship is contingent upon empirical constraints from EB systems in star forming regions with independent age estimates (Stassun et al. 2009; Torres et al. 2010).
Here, we present a radial velocity curve and individual mass measurements for the newly discovered low-mass PMS eclipsing binary, MML 53 (Hebb et al. 2010). In the first paper in this series, we showed for the first time that MML 53, which was previously identified as a late-type, lithium rich member of the 15 Myr old UCL star forming region (Mamajek et al. 2002), is in fact a detached EB. Through the analysis of multi-season photometry from the SuperWASP transiting planet survey (Pollacco et al. 2006a,b) and a single spectrum obtained from the European Southern Observatory (ESO) archive, we derived the orbital period and ephemeris for the system. In addition, we presented approximate physical parameters and lithium equivalent width measurements for the two binary components, and we confirmed the presence of a young tertiary companion to the eclipsing pair.
For this second paper in the series, we describe new time-series spectroscopic observations of MML 53 (Sect. 2), generate a radial velocity curve, and derive the orbital parameters of the system (Sect. 3). We summarize our findings and comment on planned future work in Sect. 4.
2. Observations and reductions
MML 53 was observed in queue mode with the SMARTS 1.5 m echelle spectrograph1 at the Cerro Tololo Inter-American Observatory (CTIO). The bench-mounted spectrograph, formerly on the Blanco 4 m telescope, was recomissioned for the 1.5 m in 2009. It has a fixed cross-disperser (with 266 lines mm-1) and echelle grating (with 36.1 lines mm-1) and accommodates slit widths of 60–150 μ. Thus, the instrument is capable of providing spectral resolving powers of 25 000–40 000 over a wavelength range 4020–7300 Å with ~150 Å per order.
We observed MML 53 once per night on thirteen clear or mostly clear nights between 2009 May 18 and 2009 June 12. One ThAr comparison spectrum was obtained immediately before or after each MML 53 observation. In addition, a radial velocity standard star, HD 81797 (spectral type K3 III; Udry et al. 1999), and its corresponding ThAr lamp spectrum was observed concurrently with MML 53 on eleven of the thirteen nights. One spectrum of HD 81797 was used as the radial velocity template in our cross-correlation analysis, and the others were used to monitor any systematic drifts in the spectrograph and wavelength solution during the run (see Sect. 3).
We adopted a large slit width of 140 μ for both MML 53 and HD 81797 that maximized the signal to noise (S/N) while providing sufficient spectral resolution to discern the two components of the binary. With this setting, we measured a resolution of R ~ 25 000 from the telluric lines at ~6850 Å. We obtained 3 × 600 s exposures of MML 53 which gave a S/N of ~15 per pixel (~25 per spectral resolution element) at 6800 Å. Exposures of HD 81797 were 1 × 30 s.
We performed the data reduction of the science target and radial velocity standard following standard echelle processing procedures using the packages available in IRAF2. This included trimming and overscan subtraction, bias subtraction, and flat fielding of the raw images, as well as extracting the spectrum and performing the wavelength calibration.
After completing the data processing and reduction on the individual images, cosmic-ray removal and bad pixel rejection was performed on MML 53 and the three exposures were co-added. The final data set consists of 13 extracted, normalized spectra of MML 53 taken on different nights over a three-week period, and observations of HD 81797 taken on 11 of the same 13 nights.
3. Spectroscopic analysis
3.1. Radial velocities
The IRAF cross-correlation task fxcor was used to obtain heliocentric radial velocities of MML 53 and HD 81797. A very low S/N in the observation of Julian Date 2 454 971 prevented a clear cross-correlation function for that night; consequently, it was not used in the spectroscopic analysis, leaving 12 nights with usable data. Our cross-correlation functions for MML 53 typically show two distinct peaks, corresponding to the two eclipsing components, whose velocities vary in time with the orbital period determined from the discovery light curve of Hebb et al. (2010).
In some spectra we also observed a faint, stationary third peak between the primary and secondary peaks, consistent with the presence of a third component in the system first noted by Torres et al. (2006) and confirmed by Hebb et al. (2010). As this peak could not be unambiguously identified in all of our observations, we did not attempt to derive radial velocities for this component.
We cross-correlated all the spectral orders of each MML 53 spectrum against the observation of the radial velocity standard, HD 81797, taken on the first night (Julian Date 2 454 970). We excluded the bluest orders because of low throughput and rejected several additional orders from each night’s spectrum when we could not clearly detect at least the primary star cross-correlation peak. These included orders containing strong broad lines (i.e. Na D and Hα) and/or strong telluric features. To derive the radial velocity measurements from each order, we typically fit individual Gaussian curves to the primary and secondary cross correlation peaks and used the centroids of the models to determine the heliocentric-corrected radial velocities for both components. However, on two nights (JD 2 454 990 and 2 454 991), the peaks were so blended that we were only able to measure the radial velocity of the primary star. On two additional nights (JD 2 454 972 and 2 454 992), the primary and secondary cross-correlation peaks were blended, but distinguishable, and thus it was necessary to use the deblending function in fxcor to determine the velocities of both components. Each night’s spectrum typically provided ~30 good measurements of the primary star velocity and ~20 good measurements of the secondary which we then combined into a robust weighted mean by rejecting points using a 3σ median clipping algorithm; at most 1 order was clipped. The formal errors on the Gaussian centroids, given by fxcor, acted as the statistical weights. We adopted the standard error of the mean from the remaining measurements of the individual orders as the uncertainty on the weighted mean radial velocity for each observation. The final radial velocities and their corresponding errors are presented in Table 1 and shown in Fig. 1. The reported Heliocentric Julian Dates are corrected to the mid-exposure time of each observation which accurately reflects the true flux-weighted mean of the observation since the observing conditions were clear and stable. In addition, since we typically observed the target at phases that are in the linear parts of the sine curve, our mid-exposure time velocity measurements are not significantly affected by “smearing” during the exposures.
Radial velocity measurements of MML 53.
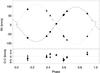 |
Fig. 1 (top) Best-fit radial velocity orbital solution for MML 53, and (bottom) residuals. The orbital period and ephemeris are held fixed at the values determined by the photometric light curve (Hebb et al. 2010). Phase 0.0 corresponds to T0, the time of minimum light of the primary eclipse. The eccentricity is also held fixed at 0 (i.e. circular orbit). Plotted are the radial velocity measurements for the primary (circles) and secondary (triangles) components. The solid symbols are used to derive the orbit solution fits for the primary (solid line) and secondary (dashed line). Open symbols were not used to fit the radial velocity curve because the primary and secondary cross-correlation peaks were blended. |
To assess systematic drifts in the spectrograph over the course of the run, we also cross-correlated the HD 81797 spectra for each night with the template from the first night. The scatter in the observed radial velocities of HD 81797 is 0.07 km s-1 about a mean that is offset by −0.07 km s-1 relative to the literature heliocentric velocity of −4.7 ± 0.3 km s-1 (Udry et al. 1999). The reduced χ2 about the mean value is  , indicating an additional systematic error term of ≈0.08 km s-1. Thus, 0.1–0.2 km s-1 is realist measure of the absolute stability of the instrument on a timescale of several weeks.
3.2. Orbit solution and physical properties
We used the EB modeling program Phoebe (PHysics Of Eclipsing BinariEs) (Prša & Zwitter 2005) built on top of the Wilson & Devinney (1971, updated 2007) code to fit an orbit solution to the radial velocity measurements of the primary and secondary components of MML 53.
We reject from the orbital fit radial velocity points in which the cross-correlation peaks were blended because the centroids of these blended Gaussians are subject to higher uncertainties than those of single Gaussians (Latham et al. 1996). In fact, both the primary and secondary velocity measurements on these nights (JD 2 454 972 and 2 454 992) appear to show slight systematic offsets due to imperfect deblending. In addition, we reject one additional point (JD 2 454 991) to avoid being susceptible to the radial velocity distortions expected from the Rossiter-McLaughlin effect (Rossiter 1924; McLaughlin 1924). The excluded data points are shown as open symbols in Fig. 1 and identified in Table 1. Thus we have nine epochs of the primary star and eight of the secondary of MML 53 (Table 1) to use in deriving the orbital solution.
The parameters held constant in our final orbit solution are: the orbital period, P = 2.097891(6) ± 0.000005; the time of primary eclipse at minimum, T0 = 2454301.3252(7) ± 0.0002 (HJD); and the eccentricity, e ≡ 0. The ephemeris was determined by Hebb et al. (2010) from over 10 000 photometric data points obtained by SuperWASP between 2006–2008, and thus the period measured from the light curve is much more precise than could be determined from the radial velocity data alone which span only three weeks. In addition, we find no significant difference in the derived epoch or the other orbital parameters if we allow T0 to be a fitted parameter (see text below), so for our final results, we fix T0 to the value derived from the light curve. Furthermore, there is no evidence in the light curve or radial-velocity data for a non-zero eccentricity, and thus we adopt an eccentricity of exactly 0.0 (i.e. circular orbit). That this short-period binary should be circular is not surprising; indeed Zahn (1989) find circularization timescales of 104–105 yr for low-mass convective stars, and Hilditch (2001) show that PMS binaries have similar behavior. Empirically it is also the case that all short-period, low-mass PMS EBs so far discovered are circular (Stassun et al. 2004; Covino et al. 2004; Irwin et al. 2007; Stassun et al. 2008). The inclination of the orbit plane relative to the line of sight does not enter into the orbit solution, except in the calculation of the Rossiter-McLaughlin effect distortions in the radial velocity curve during eclipse. These distortions are largest for i = 90°, and thus we adopt this value in our orbit fitting in order to conservatively show the maximum possible deviations from the Rossiter-McLaughlin effect that may affect our observations.
We then perform a weighted least-squares fit for the mass ratio, q = M2/M1; the semi-major axis, asini; and the center-of-mass velocity, vγ. The individual minimum masses, M1sin3i and M2sin3i are then computed from these quantities. The resulting best-fit orbit solution and the O–C residuals relative to the fit are displayed in Fig. 1.
The secondary’s residuals yield a  , indicating a good fit without significant systematic error. On the other hand the primary’s residuals yield
  . We believe this to be due to star spots on the primary star affecting the radial velocity measurements rather than the result of unaccounted systematic errors. Star spots are clearly manifested in the discovery light curve of MML 53 as a strong, sinusoidal variability signal, and the effects of such spots on the radial velocities of other low-mass stars have been typically ~1 km s-1 (e.g. Torres & Ribas 2002; Stassun et al. 2004), similar to what is observed here. The primary star residuals show a sinusoidal pattern with a period that is one-half of the orbital period. This pattern is reinforced by pairs of primary measurements near phases 0.15 and 0.6 in Fig. 1, which are from different epochs yet show very similar residuals. Thus, to characterize the effects of star spots on the primary star radial velocity measurements, we determine the best fitting sine curve that minimizes the χ2 with respect to the residuals (shown in Fig. 2). We adopt a period that is exactly one-half of the orbital period and derive an amplitude of 1.5 ± 0.2 km s-1. This interpretation is consistent with the presence of two star spots on opposite hemispheres of the primary star (assuming the stars rotate synchronously with the orbital period).
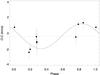 |
Fig. 2 Solid points are the residual radial velocity measurements of the primary star phase-folded with exactly one-half the orbital period of the binary. Phase 0.0 is arbitrary and does not correspond to the T0. The solid line is the best fitting model sine curve with a |

Detailed light curve modeling including spots will be needed to constrain the spot parameters and to include their effects in fitting the observed radial velocities (see, e.g., Stassun et al. 2004). For the present work, these unmodeled star spot residuals result in a systematic error term in the derived parameters of the orbit. To estimate the systematic errors on the fitted parameters, we assume for simplicity that the ±1.5 km s-1 sinusoidal variation observed in the primary’s radial velocity measurements (Fig. 1b) translates directly into a ±1.5 km s-1 systematic error in the semi-amplitude of the primary orbit. We then propagate the systematic error in these measurements to the dependent properties.
The orbital and physical parameters of MML 53 resulting from the fit to the radial velocity data are summarized in Table 2. The first uncertainty value listed for each parameter is the formal statistical uncertainty from the fit. The second uncertainty value is the estimated systematic error arising from the unmodeled spot-induced radial-velocity modulations observed in the primary component. We find the primary and secondary components of MML 53 to have minimum masses of M1sin3i = 0.97 M⊙ and M2sin3i = 0.84 M⊙ and an orbital separation of asini = 8.40 R⊙.
Results of MML 53 orbit solution.
Finally, Hebb et al. (2010) presented evidence for the presence of a spatially unresolved tertiary companion that is exerting an observable gravitational influence on the EB. Thus, we test whether the radial velocity measurements obtained in 2009 and presented here show the effects of the third star. In the first paper, we reported an offset of ~3 min in the time of minimum light determined from the 2006 light curve compared to the 2007–08 light curve which we attributed to light travel time effects due to the presence of the tertiary star. As the 2.1 d EB in MML 53 orbits the third component (over a much longer period of at least several years), the distance from the Earth to the EB changes and thus the epoch of the eclipse minima observed at Earth can vary due to the finite speed of light. In addition, the systemic radial velocity of the binary, vγ, will exhibit Keplerian variations over timescales equivalent to its long orbital period with the tertiary.
To examine whether an offset in the value of the eclipse epoch, T0, is detectable in our 2009 velocity data, we perform a second fit to the radial velocity measurements while allowing T0 to be an additional free parameter. Unfortunately, these data alone do not provide a strong constraint on the time of minimum light. We derive a –1.6 minutes offset in T0 compared to our current ephemeris, but the value has a formal uncertainty of 2.2 minutes. Thus, the T0 detected in the 2009 data is formally consistent with the ephemeris derived from the 2006–2008 light curve data. However, through this test, we confirm that the timing offset due to the tertiary does not significantly affect the orbital parameters of the close binary as derived from these data. The values of all the properties listed in Table 2 are found to be the same within their 1 sigma uncertainties regardless of whether we fix T0 to the 2006–2008 light curve ephemeris or allow it to be a free parameter.
In addition, we do not expect to see detectable changes in the center of mass velocity of the binary, vγ, over the three week duration of the observations presented here. The expected period of the binary-tertiary system is at least several years given the offset we measured in T0 of ~3 min over 2 years, thus any change in the systemic velocity of the binary would be insignificant over the duration of these data. However, we do detect a change in the vγ derived from the 2009 data presented here and the re-analysed FEROS spectrum taken in 2006 and presented in Hebb et al. (2010). In the discovery paper, we adopted a vγ for MML 53 from the literature and used the velocity measurements from the single FEROS spectrum to estimate the mass ratio of the EB. Since we have now measured the mass ratio, q, from the entire radial velocity curve, we can fix q and the ephemeris to the final values presented in Table 2 and use the velocity measurements from the FEROS spectrum to solve for the systemic radial velocity of the binary in 2006. When we perform this analysis, we find vγ equal to 5.4 km s-1 in 2006. This is a significant difference compared to the 1.4 ± 0.3 ± 0.8 km s-1 measured in 2009.
4. Summary and concluding remarks
We have produced a precise, double-lined orbit solution for the low-mass, PMS eclipsing binary MML 53. The orbit solution is based on nine measurements of the primary component and eight measurements of the secondary component obtained over a three-week period with the SMARTS 1.5 m echelle spectrograph at CTIO. From repeated observations of a radial-velocity standard star obtained on the same nights as MML 53, we find the spectrograph to be stable at the level of 0.1–0.2 km s-1 over a three-week timescale, without the use of an iodine cell.
We find the primary and secondary components of MML 53 to have minimum masses of M1sin3i = 0.97 M⊙ and M2sin3i = 0.84 M⊙. These minimum mass measurements have formal uncertainties of 2.0% and additional systematic uncertainties of ≈2.5% arising from the unmodeled systematic radial-velocity variations in the primary component with a semi-amplitude of 1.5 km s-1 and a period of half the orbital period. These variations are likely due to spots on the primary star as spot-related photometric variations are clearly observed in the discovery photometry. Using the approximate inclination angle of i = 83.1° derived from the single-band discovery light curve presented in Hebb et al. (2010), we determine M1 = 0.99 M⊙ and M2 = 0.86 M⊙ to be the individual masses of the MML 53 eclipsing components.
We also detect the presence of the tertiary companion as a change in the systemic velocity of the eclipsing system between 2006 and 2009. Thus, based on the growing evidence that the EB is experiencing an additional gravitational influence which is affecting the timing of the eclipses and the center of mass velocity of the system combined with the Li i measurements obtained in Hebb et al. (2010), this third component is very likely to be a physically associated, young low-mass companion in a wide orbit about the MML 53 EB.
Finally, MML 53 has been determined to be a probable member of the UCL star forming region (~15 Myr) based on its proper motion and parallax (>82% probability; Mamajek et al. 2002), and UVW space velocities (Torres et al. 2006). We note that our newly determined center-of-mass velocity (vγ = +1.4 ± 0.3 ± 0.8 km s-1) for MML 53 is consistent with the previous measurement from Torres et al. (+2 km s-1, based on an average over 4 observations; 2006). In addition, with our new center-of-mass velocity, and assuming a distance of 136 pc (7.36 mas parallax; Mamajek et al. 2002) together with catalogue proper motions from NOMAD 1.0, we calculated improved UVW space velocities of [U,V,W] = [−7.4,−19.4,−6.0] for MML 53. These values have an uncertainty of ~2 km s-1 in each component. They are consistent with the space motion for the association determined by Aarnio et al. (2008) of [U,V,W] = [−5.4,−19.7,−4.4] ± 0.4 km s-1. Together with the presence of strong Li absorption in MML 53, these kinematic determinations confirm the very probable membership of MML 53 in UCL (age ~15 Myr; Carpenter et al. 2009).
We have a comprehensive study underway to further characterize the physical properties of MML 53. Very high S/N, high resolution follow-up spectra allowing for tomographic reconstruction of the component stars will permit definitive measurement of the Li abundances, precise determination of the effective temperature of the primary star, and orbital and spectroscopic properties of the tertiary. Furthermore, with a simultaneous multi-band light curve model, we will be able to determine the system inclination and thus the independent component masses accurately, as well as the radii and secondary star temperature. The light curve modeling will additionally permit a detailed treatment of the spot-related effects in both the light curve and in the radial-velocity curve, which should in turn reduce the systematic uncertainties in the orbit solution which currently limit the accuracy of the masses.
IRAF is distributed by the National Optical Astronomy Observatories, which are operated by the Association of Universities for Research in Astronomy, Inc., under cooperative agreement with the National Science Foundation (Tody 1993).
Acknowledgments
This work is based on observations obtained with the SMARTS Consortium 1.5 m telescope at the Cerro Tololo Inter-American Observatory, National Optical Astronomy Observatory, operated by the Association of Universities for Research in Astronomy, under contract with the National Science Foundation. H.M.C. acknowledges support from NSF REU
site grant PHY-0649123. K.G.S. acknowledges support from NSF Career award AST-0349075 and a Cottrell Scholarship from the Research Corporation. L.E.P. was supported by NSF PAARE grant AST-0750898 to Fisk University (K. Stassun, PI). L.H. acknowledges the support of NSF grant AST-1009810 (L. Hebb, PI).
References
- Aarnio, A. N., Weinberger, A. J., Stassun, K. G., Mamajek, E. E., & James, D. J. 2008, AJ, 136, 2483 [NASA ADS] [CrossRef] [Google Scholar]
- Andersen, J. 1991, ARA&A, 3, 91 [Google Scholar]
- Carpenter, J. M., Bouwman, J., Mamajek, E. E., et al. 2009, ApJS, 181, 197 [NASA ADS] [CrossRef] [Google Scholar]
- Covino, E., Frasca, A., Alcalá, J. M., Paladino, R., & Sterzik, M. F. 2004, A&A, 427, 637 [NASA ADS] [CrossRef] [EDP Sciences] [Google Scholar]
- Elmegreen, B. G. 2009, The Evolving ISM in the Milky Way and Nearby Galaxies [Google Scholar]
- Haisch, K. E., Jr., & Lada, E. A. 2001, 11th Cambridge Workshop on Cool Stars, Stellar Systems and the Sun, ASP Conf. Ser., 223, 19 [NASA ADS] [Google Scholar]
- Hebb, L., Stempels, H. C., Collier-Cameron, A., et al. 2010, A&A, 522, A37 [NASA ADS] [CrossRef] [EDP Sciences] [Google Scholar]
- Hilditch, R. W. 2001, An Introduction to Close Binary Stars (Cambridge: University Press), 1 edn., 153 [Google Scholar]
- Hillenbrand, L. A., & White, R. J. 2004, ApJ, 604, 741 [NASA ADS] [CrossRef] [Google Scholar]
- Irwin, J., Aigrain, S., Hodgkin, S., et al. 2007, MNRAS, 380, 541 [NASA ADS] [CrossRef] [Google Scholar]
- Latham, D. W., Nordstroem, B., Andersen, J., et al. 1996, A&A, 314, 864 [NASA ADS] [Google Scholar]
- Laughlin, G. 2000, ApJ, 545, 1064 [NASA ADS] [CrossRef] [Google Scholar]
- Mamajek, E. E., Meyer, M. R., & Liebert, J. 2002, AJ, 124, 1670 [NASA ADS] [CrossRef] [Google Scholar]
- Mathieu, R. D., Baraffe, I., Simon, M., Stassun, K. G., & White, R. 2007, Prot. Plan. V, 411 [Google Scholar]
- McLaughlin, D. B. 1924, ApJ, 60, 22 [NASA ADS] [CrossRef] [Google Scholar]
- Muench, A. A., Lada, E. A., Lada, C. J., & Alves, J. 2002, ApJ, 573, 366 [NASA ADS] [CrossRef] [Google Scholar]
- Pollacco, D. L., Skillen, I., Collier Cameron, A., et al. 2006a, PASP, 118, 1407 [NASA ADS] [CrossRef] [Google Scholar]
- Pollacco, D., Skillen, I., Collier Cameron, A., et al. 2006b, AP&SS, 304, 253 [NASA ADS] [CrossRef] [Google Scholar]
- Prša, A., & Zwitter, T. 2005, ApJ, 628, 426 [NASA ADS] [CrossRef] [Google Scholar]
- Rossiter, R. A. 1924, ApJ, 60, 15 [NASA ADS] [CrossRef] [Google Scholar]
- Stassun, K. G., Mathieu, R. D., Vaz, L. P. R., Stroud, N., & Vrba, F. J. 2004, ApJS, 151, 357 [NASA ADS] [CrossRef] [Google Scholar]
- Stassun, K. G., Mathieu, R. D., & Valenti, J. A. 2007, ApJ, 664, 1154 [NASA ADS] [CrossRef] [Google Scholar]
- Stassun, K. G., Mathieu, R. D., Cargile, P. A., et al. 2008, Nature, 453, 1079 [NASA ADS] [CrossRef] [PubMed] [Google Scholar]
- Stassun, K. G., Hebb, L., López-Morales, M., & Prša, A. 2009, IAU Symp., 258, 161 [NASA ADS] [Google Scholar]
- Tody, D. 1993, Astronomical Data Analysis Software and Systems II, ASP Conf. Ser., 52, 173 [NASA ADS] [Google Scholar]
- Torres, G., & Ribas, I. 2002, ApJ, 567, 1140 [NASA ADS] [CrossRef] [Google Scholar]
- Torres, C. A. O., Quast, G. R., da Silva, L., et al. 2006, A&A, 460, 695 [NASA ADS] [CrossRef] [EDP Sciences] [Google Scholar]
- Torres, G., Andersen, J., & Gimenez, A. 2010, ARA&A, 18, 67 [Google Scholar]
- Udry, S., Mayor, M., & Queloz, D. 1999, Precise Stellar Radial Velocities, IAU Colloq., 170, 185, 367 [Google Scholar]
- Wilson, R. E., & Devinney, E. J. 1971, ApJ, 166, 605 [NASA ADS] [CrossRef] [Google Scholar]
- Zahn, J.-P. 1989, A&A, 220, 112 [NASA ADS] [Google Scholar]
All Tables
All Figures
|
Fig. 1 (top) Best-fit radial velocity orbital solution for MML 53, and (bottom) residuals. The orbital period and ephemeris are held fixed at the values determined by the photometric light curve (Hebb et al. 2010). Phase 0.0 corresponds to T0, the time of minimum light of the primary eclipse. The eccentricity is also held fixed at 0 (i.e. circular orbit). Plotted are the radial velocity measurements for the primary (circles) and secondary (triangles) components. The solid symbols are used to derive the orbit solution fits for the primary (solid line) and secondary (dashed line). Open symbols were not used to fit the radial velocity curve because the primary and secondary cross-correlation peaks were blended. |
| In the text | |
|
Fig. 2 Solid points are the residual radial velocity measurements of the primary star phase-folded with exactly one-half the orbital period of the binary. Phase 0.0 is arbitrary and does not correspond to the T0. The solid line is the best fitting model sine curve with a |
| In the text | |
Current usage metrics show cumulative count of Article Views (full-text article views including HTML views, PDF and ePub downloads, according to the available data) and Abstracts Views on Vision4Press platform.
Data correspond to usage on the plateform after 2015. The current usage metrics is available 48-96 hours after online publication and is updated daily on week days.
Initial download of the metrics may take a while.