Fig. 12
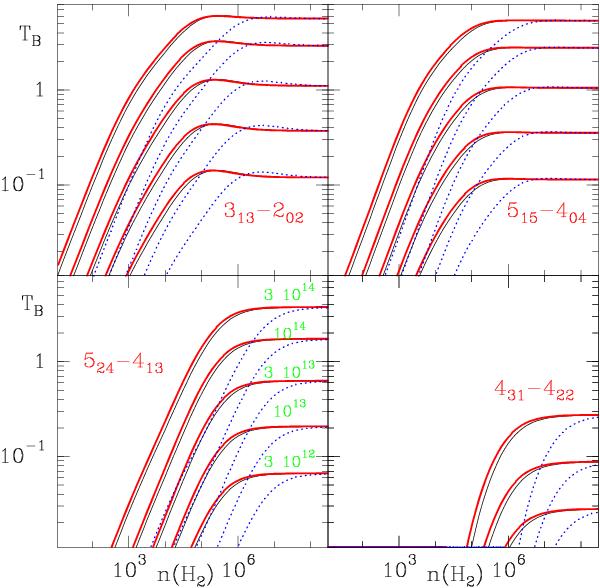
Predicted intensities for the SO2 lines of Table 4. The assumed kinetic temperature and Δv= are 10 K and 1 km s-1, respectively. Units for the density and TB are cm-3 and Kelvin, respectively. Black thin lines correspond to the predictions for the SO2/o-H2 system (this work), red thick lines to the SO2/p-H2 system (this work), and blue dotted lines to SO2-He (rates from Green 1995; extrapolated down to 10 K as indicated in the text).
Current usage metrics show cumulative count of Article Views (full-text article views including HTML views, PDF and ePub downloads, according to the available data) and Abstracts Views on Vision4Press platform.
Data correspond to usage on the plateform after 2015. The current usage metrics is available 48-96 hours after online publication and is updated daily on week days.
Initial download of the metrics may take a while.