Fig. 3
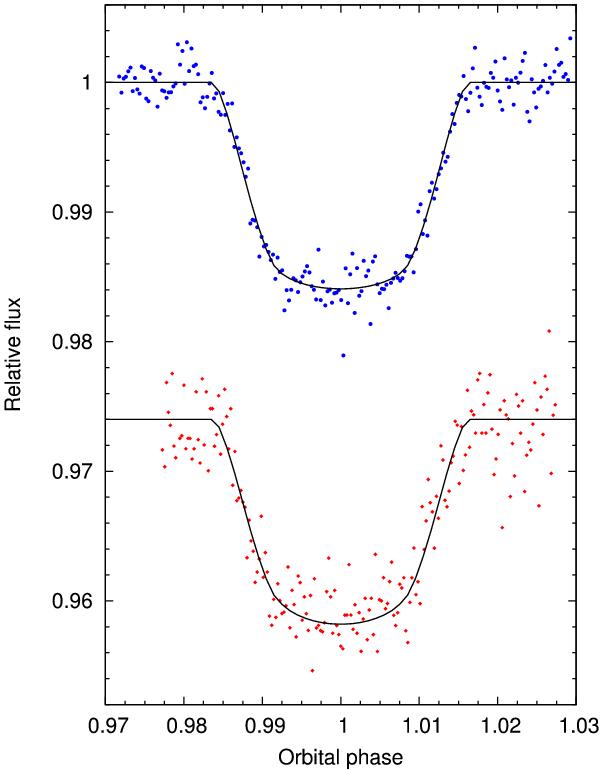
High-S/N transit light curves. The upper observations (blue circles) were obtained by FTN, using a Pan-STARRS z filter, on 2010 Feb. 26. The lower observations (red diamonds), offset in relative flux by 0.026 for display, were obtained by Euler, using a Gunn r filter, on 2010 Apr. 15. The best-fitting transit models generated from the parameters of Table 4 are overplotted.
Current usage metrics show cumulative count of Article Views (full-text article views including HTML views, PDF and ePub downloads, according to the available data) and Abstracts Views on Vision4Press platform.
Data correspond to usage on the plateform after 2015. The current usage metrics is available 48-96 hours after online publication and is updated daily on week days.
Initial download of the metrics may take a while.