Free Access
Fig. 10
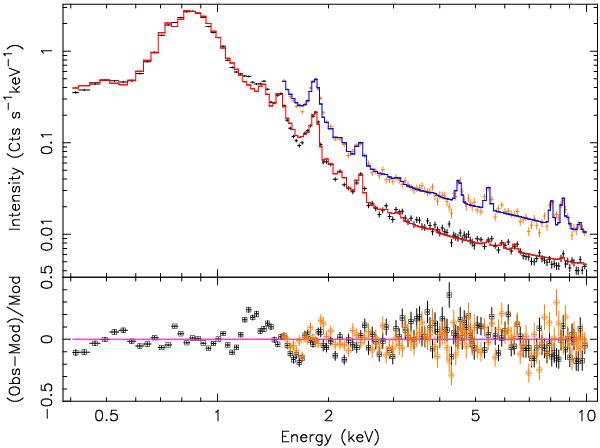
EPIC spectrum of NGC 5813. The top panel shows the data points with the model as a histogram through them. Upper data set: EPIC-pn, bottom data set: EPIC-MOS. The bottom plot shows the fitting residuals. Squares: EPIC-pn, circles: EPIC-MOS.
Current usage metrics show cumulative count of Article Views (full-text article views including HTML views, PDF and ePub downloads, according to the available data) and Abstracts Views on Vision4Press platform.
Data correspond to usage on the plateform after 2015. The current usage metrics is available 48-96 hours after online publication and is updated daily on week days.
Initial download of the metrics may take a while.