Fig. 6
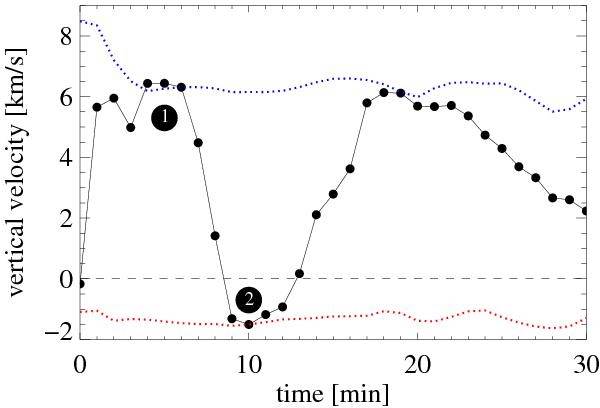
Temporal evolution of the vertical velocity vz along the field line followed in Fig. 5 at the position of highest C iv (1548 Å) intensity. (1) and (2) indicate the two different field line configurations shown in Fig. 5, associated with different flow patterns along the field line. (1): Material is flowing upwards along the field line at the site of highest C iv (1548 Å) corresponding to an observed blueshift. (2): Material is flowing downwards along the field line at the site of highest C iv intensity corresponding to an observed redshift.
Current usage metrics show cumulative count of Article Views (full-text article views including HTML views, PDF and ePub downloads, according to the available data) and Abstracts Views on Vision4Press platform.
Data correspond to usage on the plateform after 2015. The current usage metrics is available 48-96 hours after online publication and is updated daily on week days.
Initial download of the metrics may take a while.