Free Access
Fig. 2
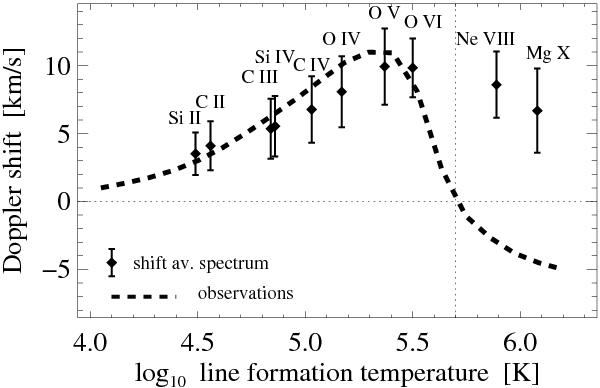
Average Doppler shifts derived from MHD model as function of line formation temperature. The height of the bars indicates the width of the distribution obtained by averaging horizontally over all line profiles at each height in the simulation box.
Current usage metrics show cumulative count of Article Views (full-text article views including HTML views, PDF and ePub downloads, according to the available data) and Abstracts Views on Vision4Press platform.
Data correspond to usage on the plateform after 2015. The current usage metrics is available 48-96 hours after online publication and is updated daily on week days.
Initial download of the metrics may take a while.