Fig. C.1
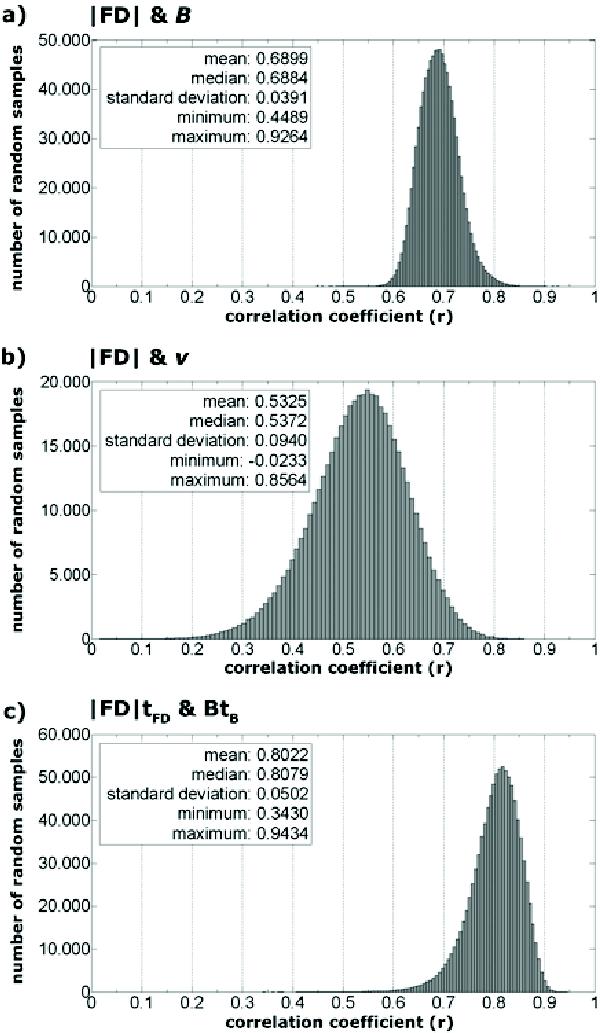
Correlation histogram for a) FD magnitude, |FD|, versus IMF magnitude, B; b) |FD| versus solar wind speed, vrel; c) the product of the FD magnitude and duration, |FD|tFD, versus the product of the magnetic field enhancement and duration, BtB. The y-axis represents the number of correlations in specific correlation coefficient class (x-axis). Each histogram is based on one million calculated correlation coefficients.
Current usage metrics show cumulative count of Article Views (full-text article views including HTML views, PDF and ePub downloads, according to the available data) and Abstracts Views on Vision4Press platform.
Data correspond to usage on the plateform after 2015. The current usage metrics is available 48-96 hours after online publication and is updated daily on week days.
Initial download of the metrics may take a while.