Fig. 1
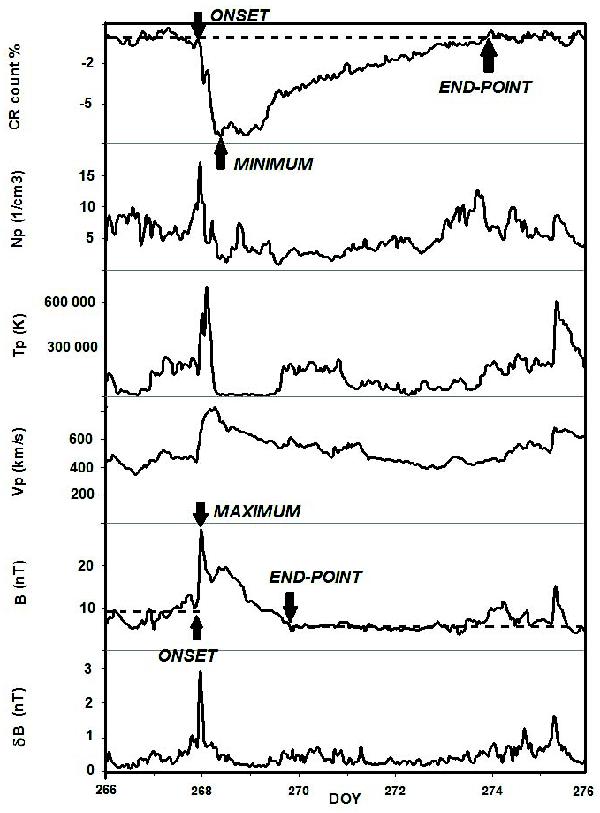
ICME that occurred 24.09.1998. Predecrese level is marked by a dashed line in the CR count curve, defining the onset and the end point of FD. Along with the minimum of the CR count, these time points are used to obtain the recovery time (trec) and the duration of FD (tFD = tfall + trec), where tfall is the time interval between the onset and the minimum and trec is the time interval between the minimum and the end point. Similarly, dashed lines given as the pre-increase and post-increase levels in magnetic field strength data are used to define the onset (entry into ICME) and the end point (exit from ICME), that give the decay (tdec) and the duration (tB = trise + tdec) of the SW disturbance, trise and tdec representing the time intervals between the onset and the maximum, and the maximum and the end point, respectively.
Current usage metrics show cumulative count of Article Views (full-text article views including HTML views, PDF and ePub downloads, according to the available data) and Abstracts Views on Vision4Press platform.
Data correspond to usage on the plateform after 2015. The current usage metrics is available 48-96 hours after online publication and is updated daily on week days.
Initial download of the metrics may take a while.