Fig. 15
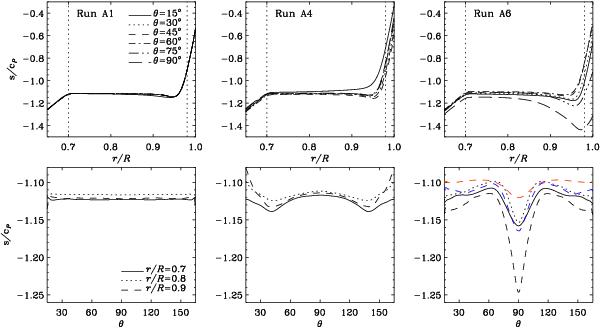
Top row: radial profiles of entropy from six colatitudes as indicated by the legend in the leftmost panel from Runs A1 (left column), A4 (middle column), and A6 (right column). Bottom row: latitudinal entropy profiles for the same runs as in the upper row at three radial positions indicated by the legend in the left panel. The red and blue dashed curves in the lower right panel show data at r = 0.9R from Runs C1 and D2, respectively.
Current usage metrics show cumulative count of Article Views (full-text article views including HTML views, PDF and ePub downloads, according to the available data) and Abstracts Views on Vision4Press platform.
Data correspond to usage on the plateform after 2015. The current usage metrics is available 48-96 hours after online publication and is updated daily on week days.
Initial download of the metrics may take a while.