Fig. 7
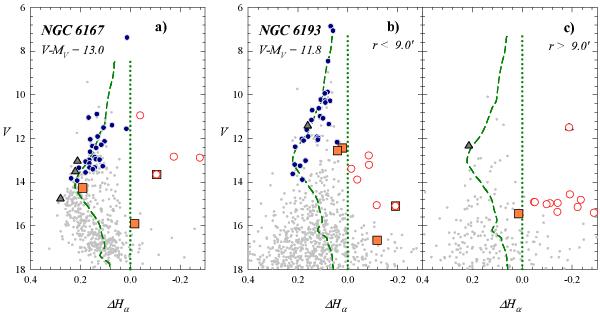
V vs. ΔHα index of stars located in NGC 6167 region (left panel) and placed in NGC 6193 region and its surrounding (right panel). Symbols are the same as in Fig. 4. Dashed (green) curves are the empirical MS form using Didelon (1982) and Feigelson (1983) parameters. These curves are corrected by the adopted apparent distance moduli for each cluster (see Table 4). Dotted vertical lines indicate the adopted limit to separate Hα emitting objects (see Sect. 3.3).
Current usage metrics show cumulative count of Article Views (full-text article views including HTML views, PDF and ePub downloads, according to the available data) and Abstracts Views on Vision4Press platform.
Data correspond to usage on the plateform after 2015. The current usage metrics is available 48-96 hours after online publication and is updated daily on week days.
Initial download of the metrics may take a while.