Fig. 4
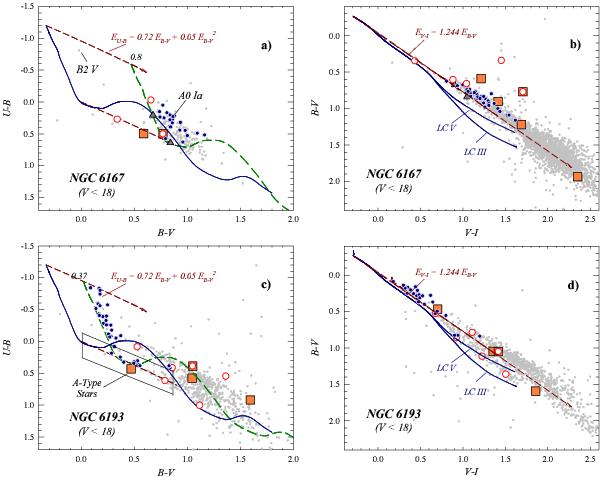
Optical TCDs of stars located in NGC 6167 (upper panel) and NGC 6193 (lower panel) regions. U − B vs. B − V diagrams: filled (blue) circles are adopted likely members for each cluster, open (red) circles are likely Hα emitter stars; big (orange) squares and filled (grey) triangles are respectively considered probable class I and class II objects (see Sect. 3.4 and also the comments for each cluster); light dots are considered as field stars. The solid (blue) curve is the Schmidt-Kaler (1982) ZAMS, while dashed (green) lines are the same ZAMS, but shifted along the reddening line (red) by the adopted colour excesses indicated above them. They correspond to the adopted values for the cluster stars (see Table 4). B − V vs. V − I diagrams: symbols have the same meaning as in plots a) and c), whereas solid curves (blue) are intrinsic colours for luminosity class V and III from Cousins (1978a,b). Dashed (red) arrows indicate the normal reddening path (RV = 3.1).
Current usage metrics show cumulative count of Article Views (full-text article views including HTML views, PDF and ePub downloads, according to the available data) and Abstracts Views on Vision4Press platform.
Data correspond to usage on the plateform after 2015. The current usage metrics is available 48-96 hours after online publication and is updated daily on week days.
Initial download of the metrics may take a while.